Exploratory Analysis of Unaccompanied Migrant Children Data
In 2023, the New York Times released data about the number of unaccompanied migrant children who have crossed into the United States. The U.S. Department of Human Health and Services keeps this data, and the NYT gained access to it through the Freedom of Information Act. Conditions for these children are often dire, with many facing violence, abuse, and poverty. As the newspaper notes, Americans have used these children to build roofs and work the night shift of dangerous jobs. Frequently, federal agencies ignored numerous warnings about the exploitation of these children.
The release of the dataset shows just how dire the conditions are for many of these children. From a quick glance online, it does not seem that many individuals are looking at the dataset in any detail. Consequently, I decided to dive deeper into the dataset to uncover insights and trends about these children. What countries do they come from? What areas of the country are most statistically likely to receive them? How has the number of children changed over time? What are some predictors that increase the number of days unaccompanied children spend in U.S. custody?
Breakdown of Gender
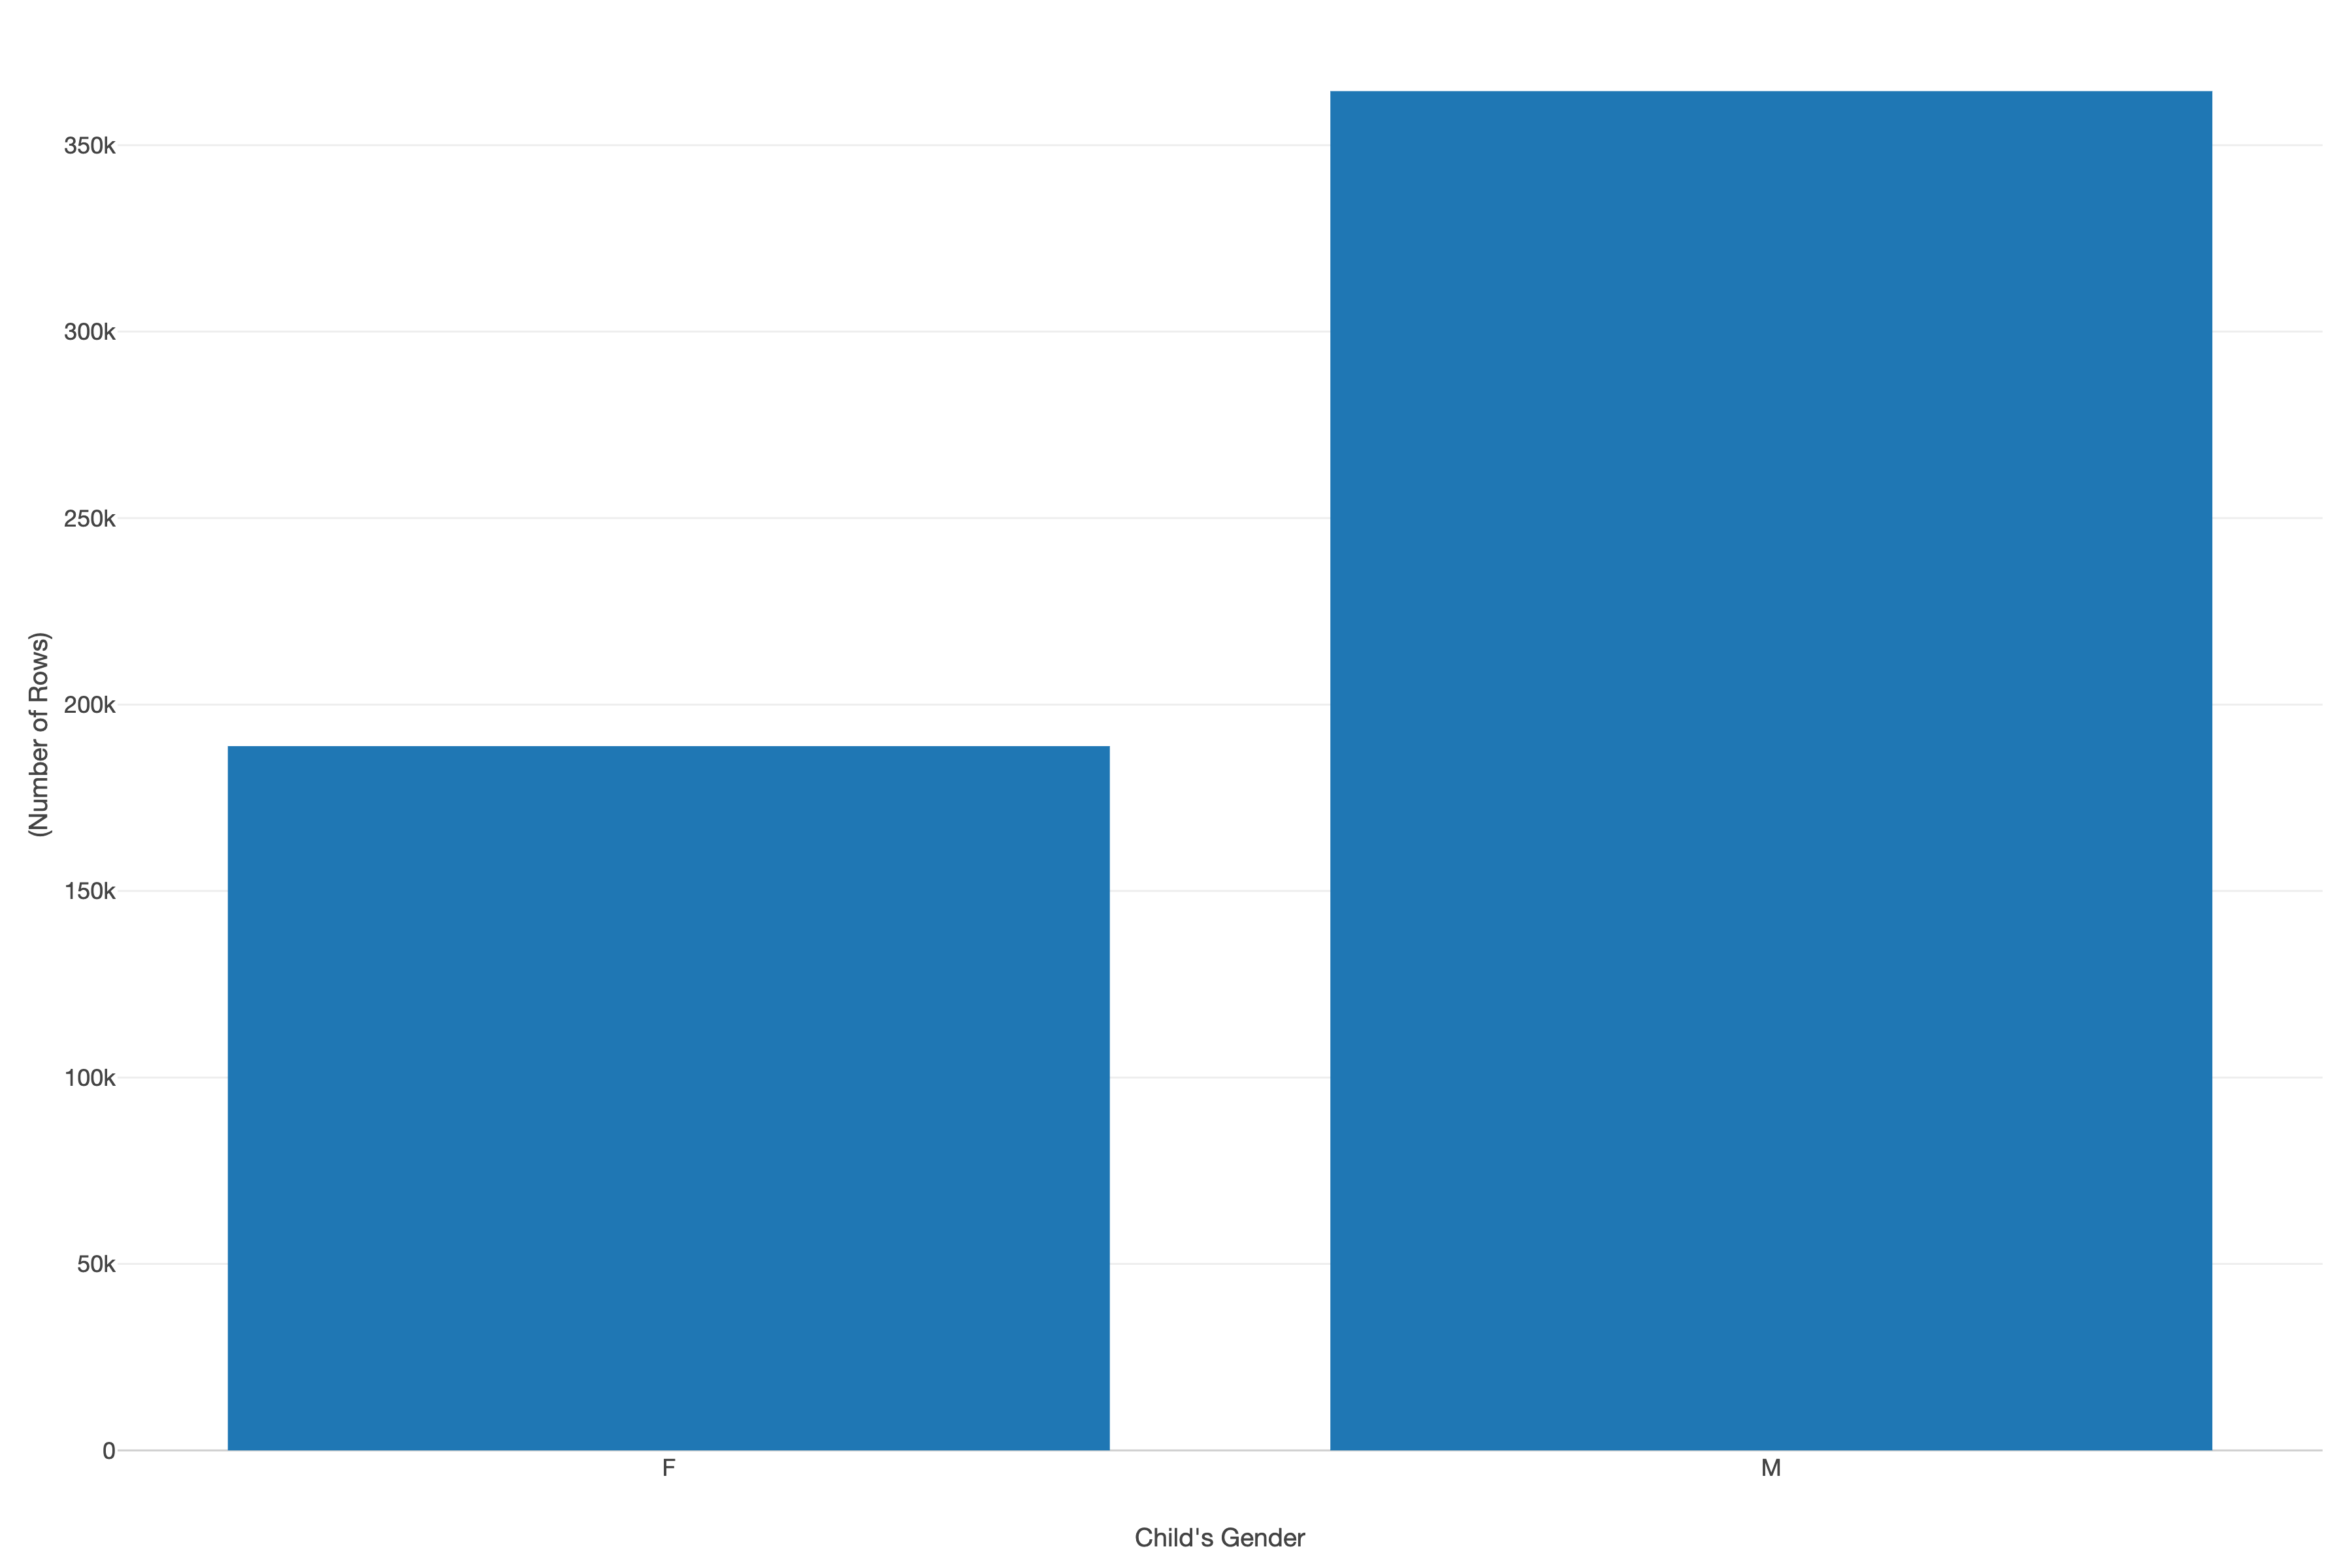
! Bar chart showing a higher number of male unaccompanied migrant children compared to female
Breaking down the data by gender, we can see that the majority of unaccompanied migrant children are male. This gender disparity raises questions about the factors driving more boys to make the dangerous journey alone. Economic pressures and societal expectations could be playing a role in pushing more boys to seek opportunities abroad.
Country of Origin
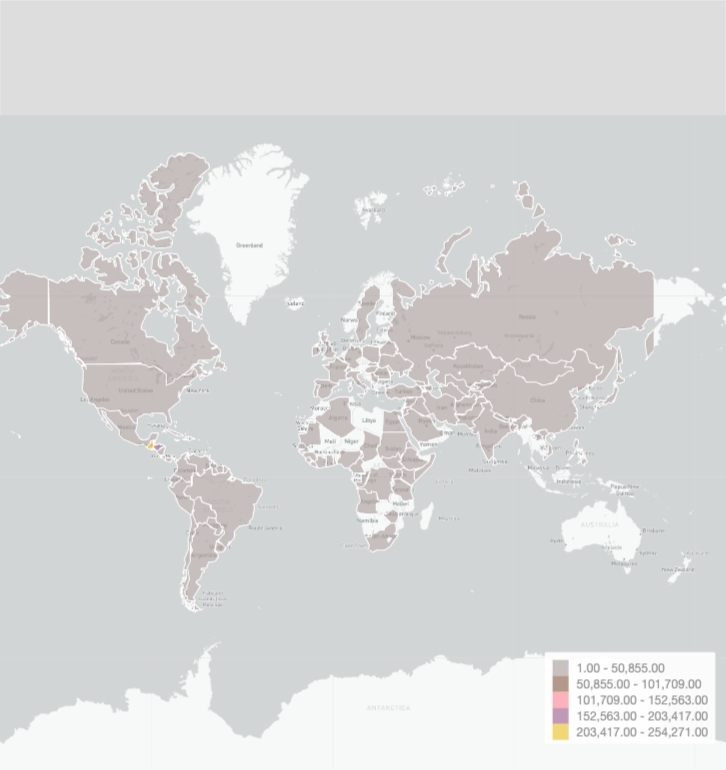
The choropleth map depicts the country of origin for each unaccompanied migrant child. The map uses a color gradient, with darker shades representing more children originating from those countries. The visual representation allows us to identify these vulnerable children’s primary sources quickly. Guatemala, Honduras, and El Salvador stand out as the darkest shades on the map, indicating that they are the countries from which the majority of unaccompanied migrant children originate. This finding highlights the dire conditions and instability plaguing these Central American nations.
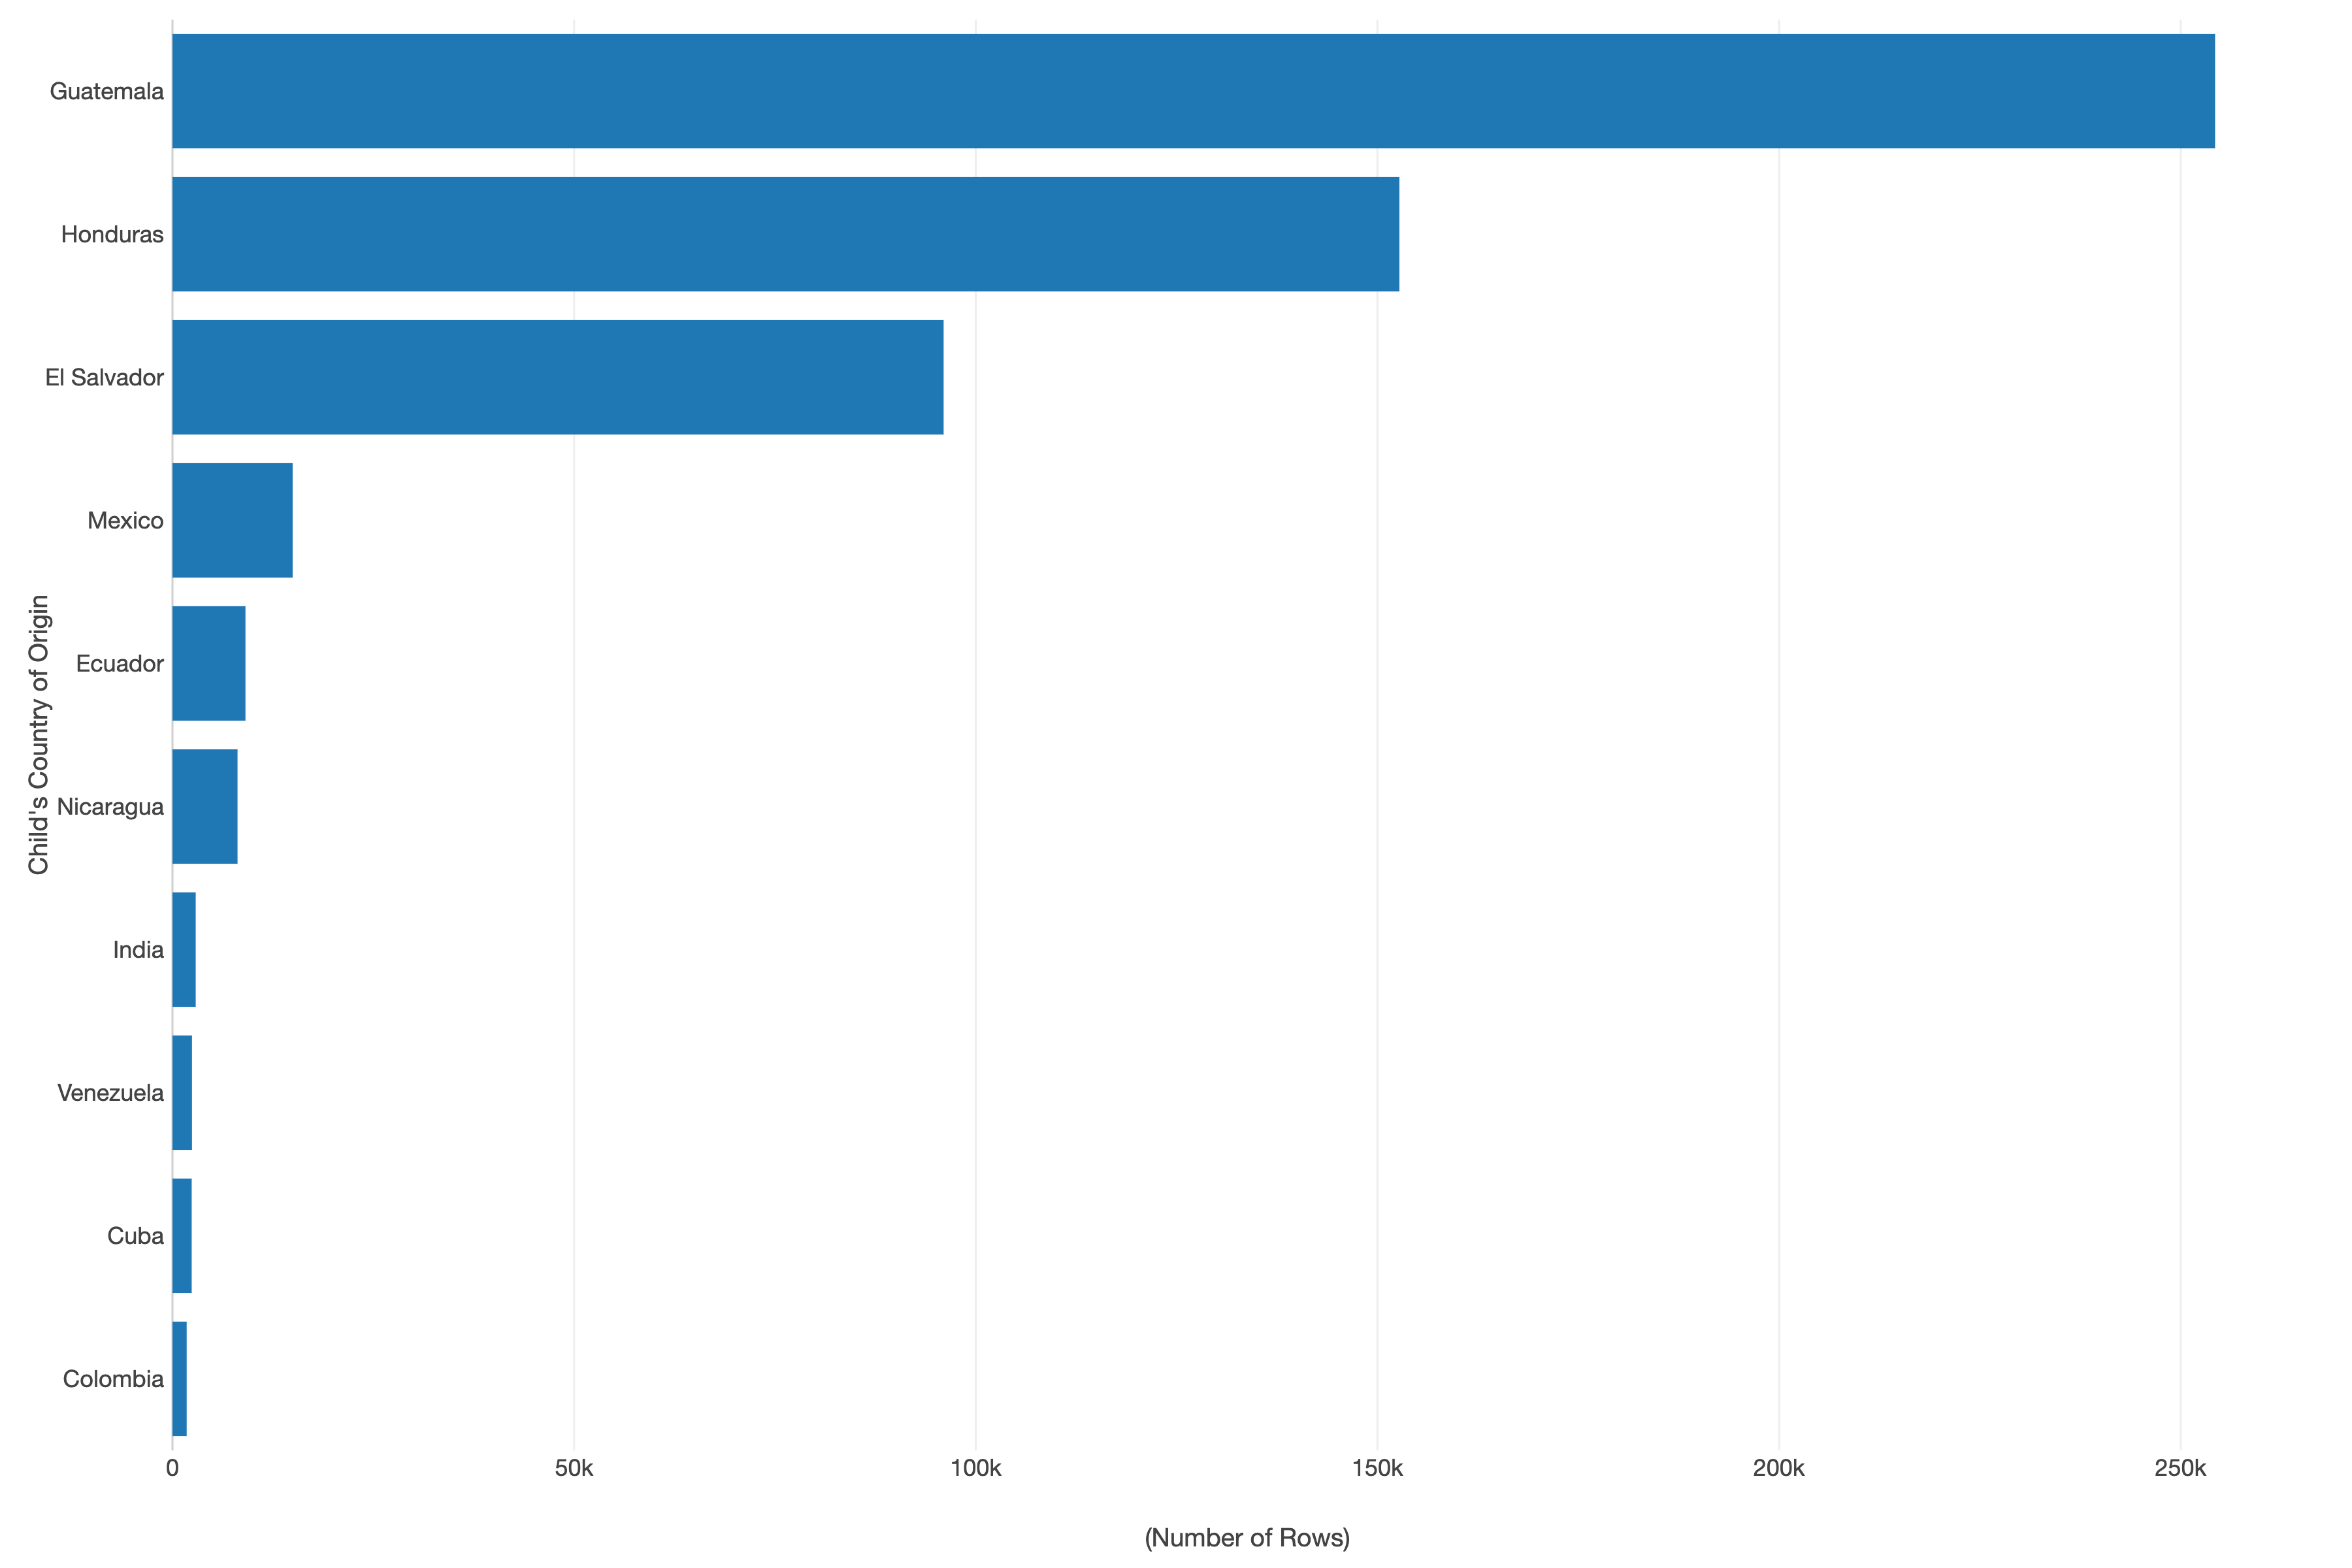
The bar chart below shows that most of the top ten countries are in Central or South America. One noticeable exception is India. While seventh on the list, the journey of unaccompanied children from India raises the need for a more comprehensive global examination of the factors driving children to undertake such dangerous journeys.
Date of Entry and Release
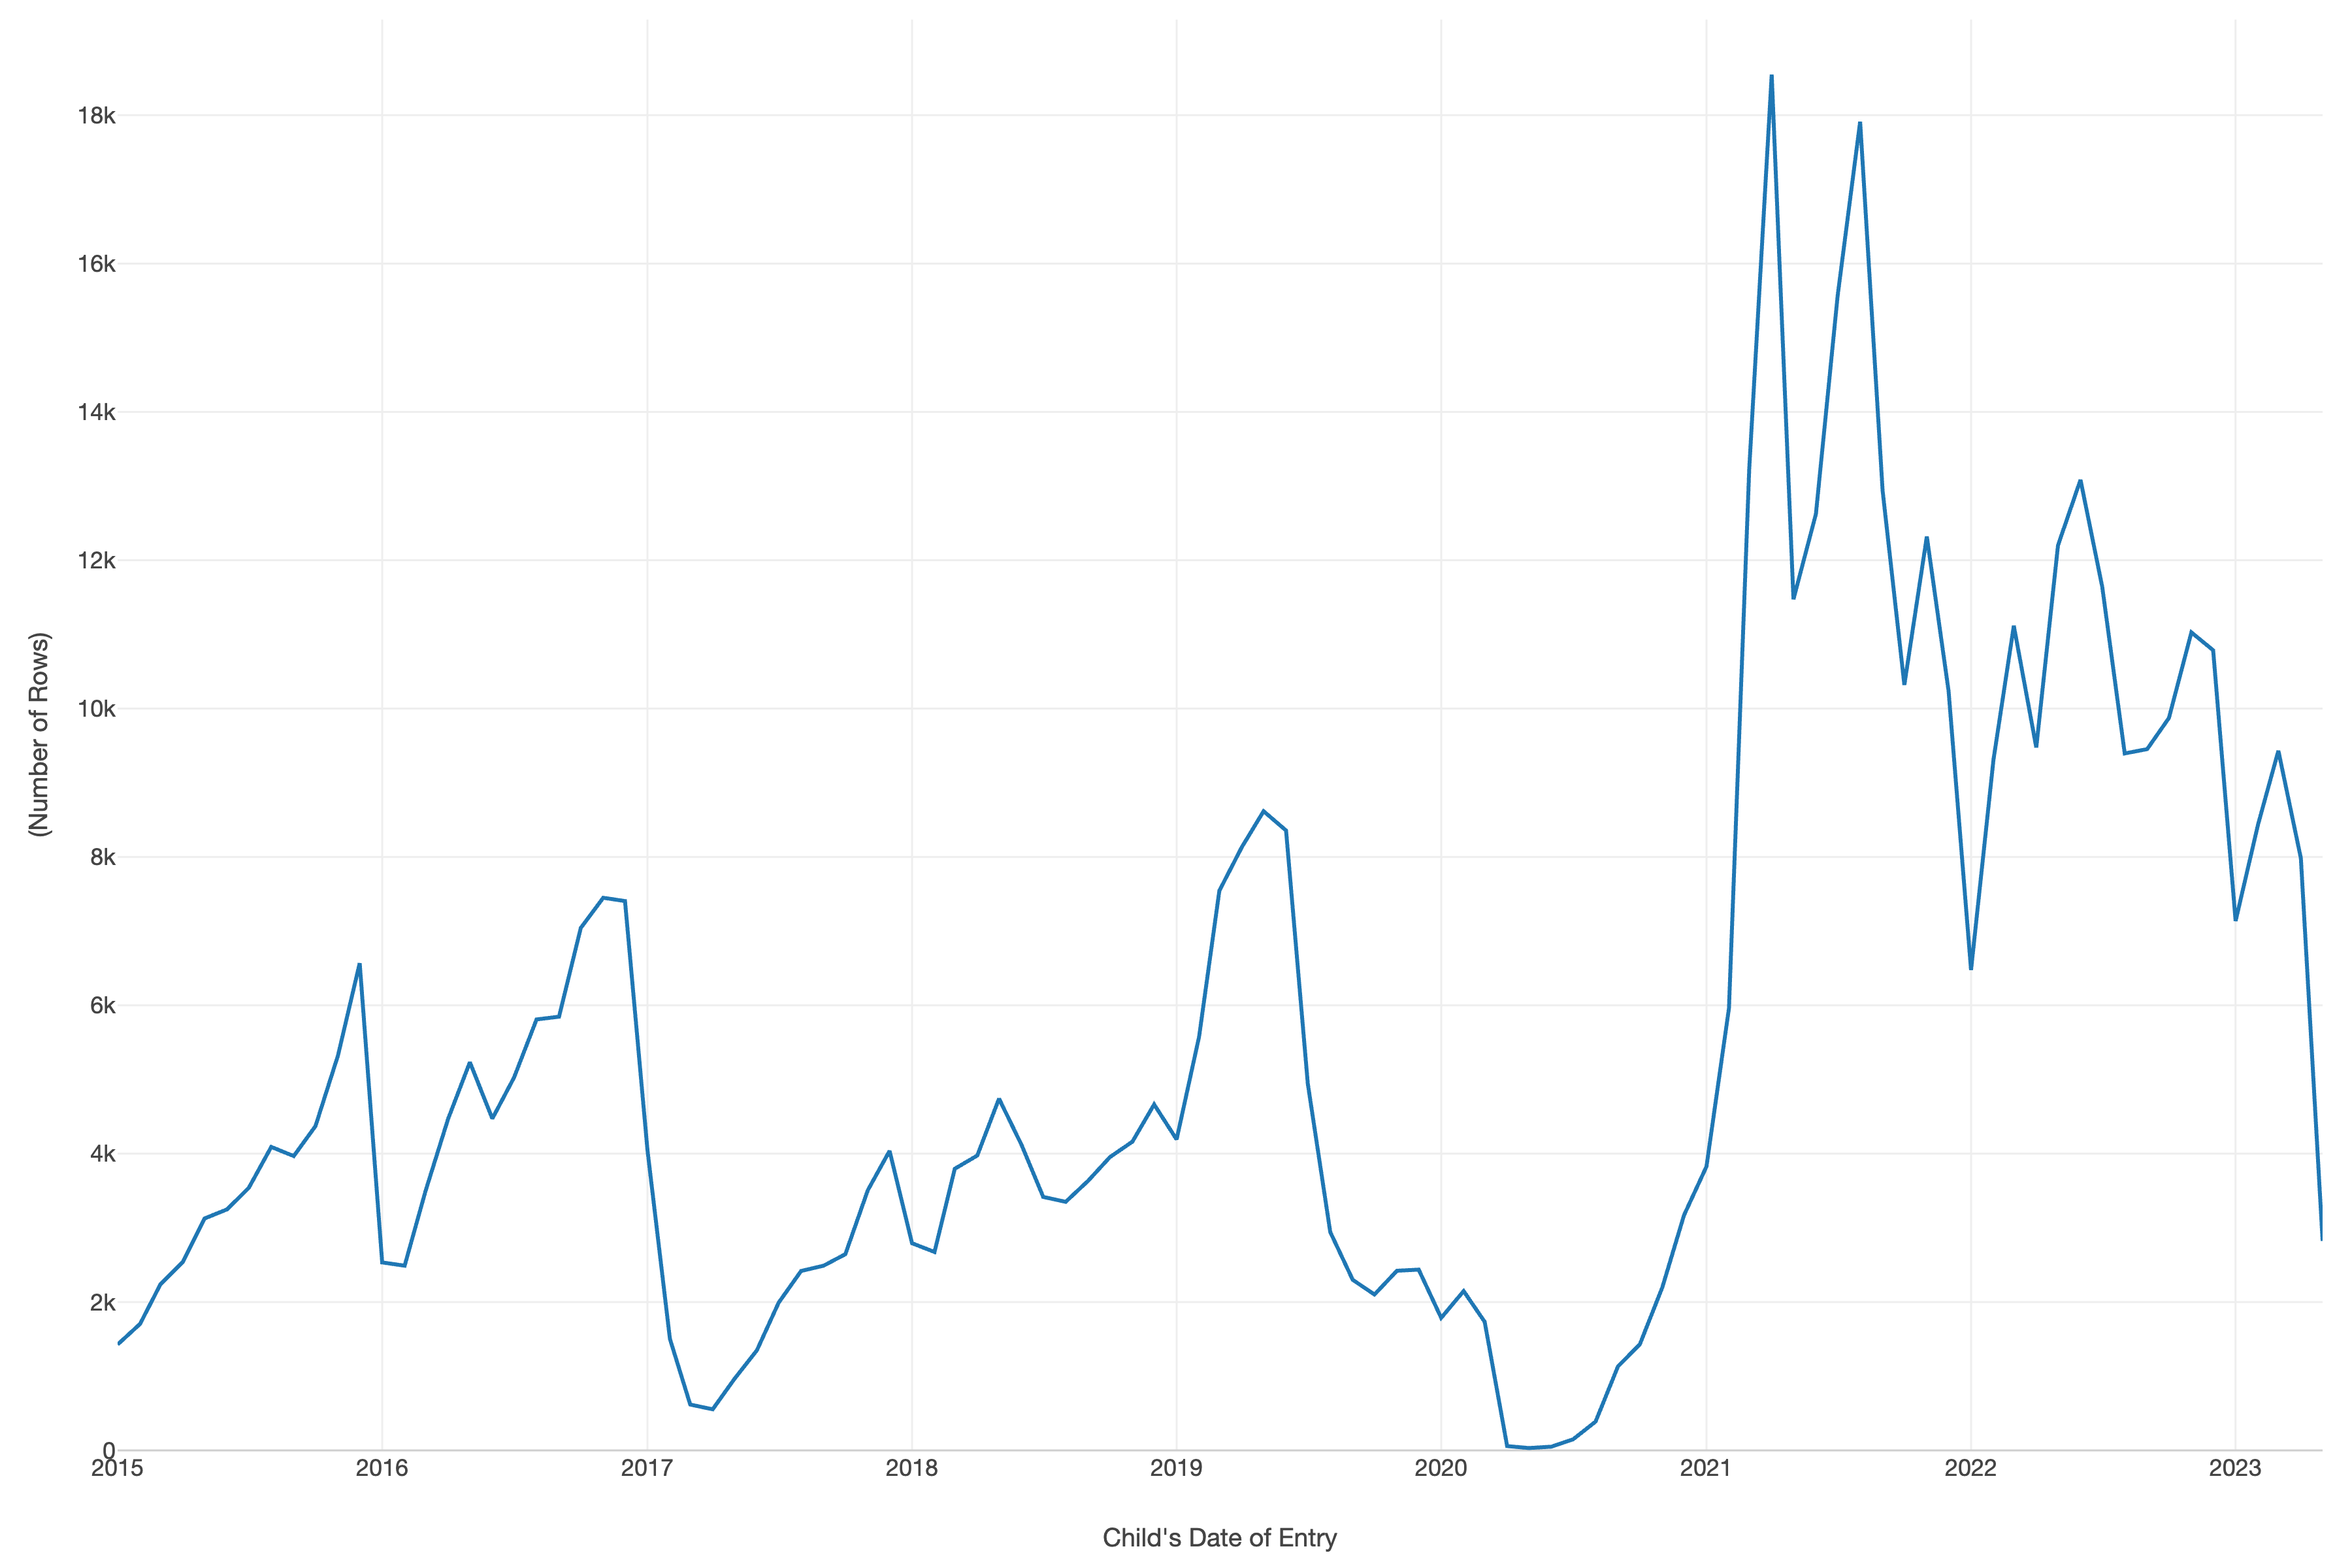
! Line chart showing a surge in unaccompanied migrant children entries starting mid-2020
We see a very high surge starting in mid-2020. Before this, the number of children had almost fallen to zero. This coincides with the onset of the COVID-19 pandemic, suggesting a potential correlation between the global health crisis and the increased number of unaccompanied migrant children. This surge seems to have lasted for about a year before tapering off in mid-2021. However, the numbers remain higher than pre-pandemic levels, indicating a persistent issue.
! Line chart showing the number of releases over time, decreasing towards the present
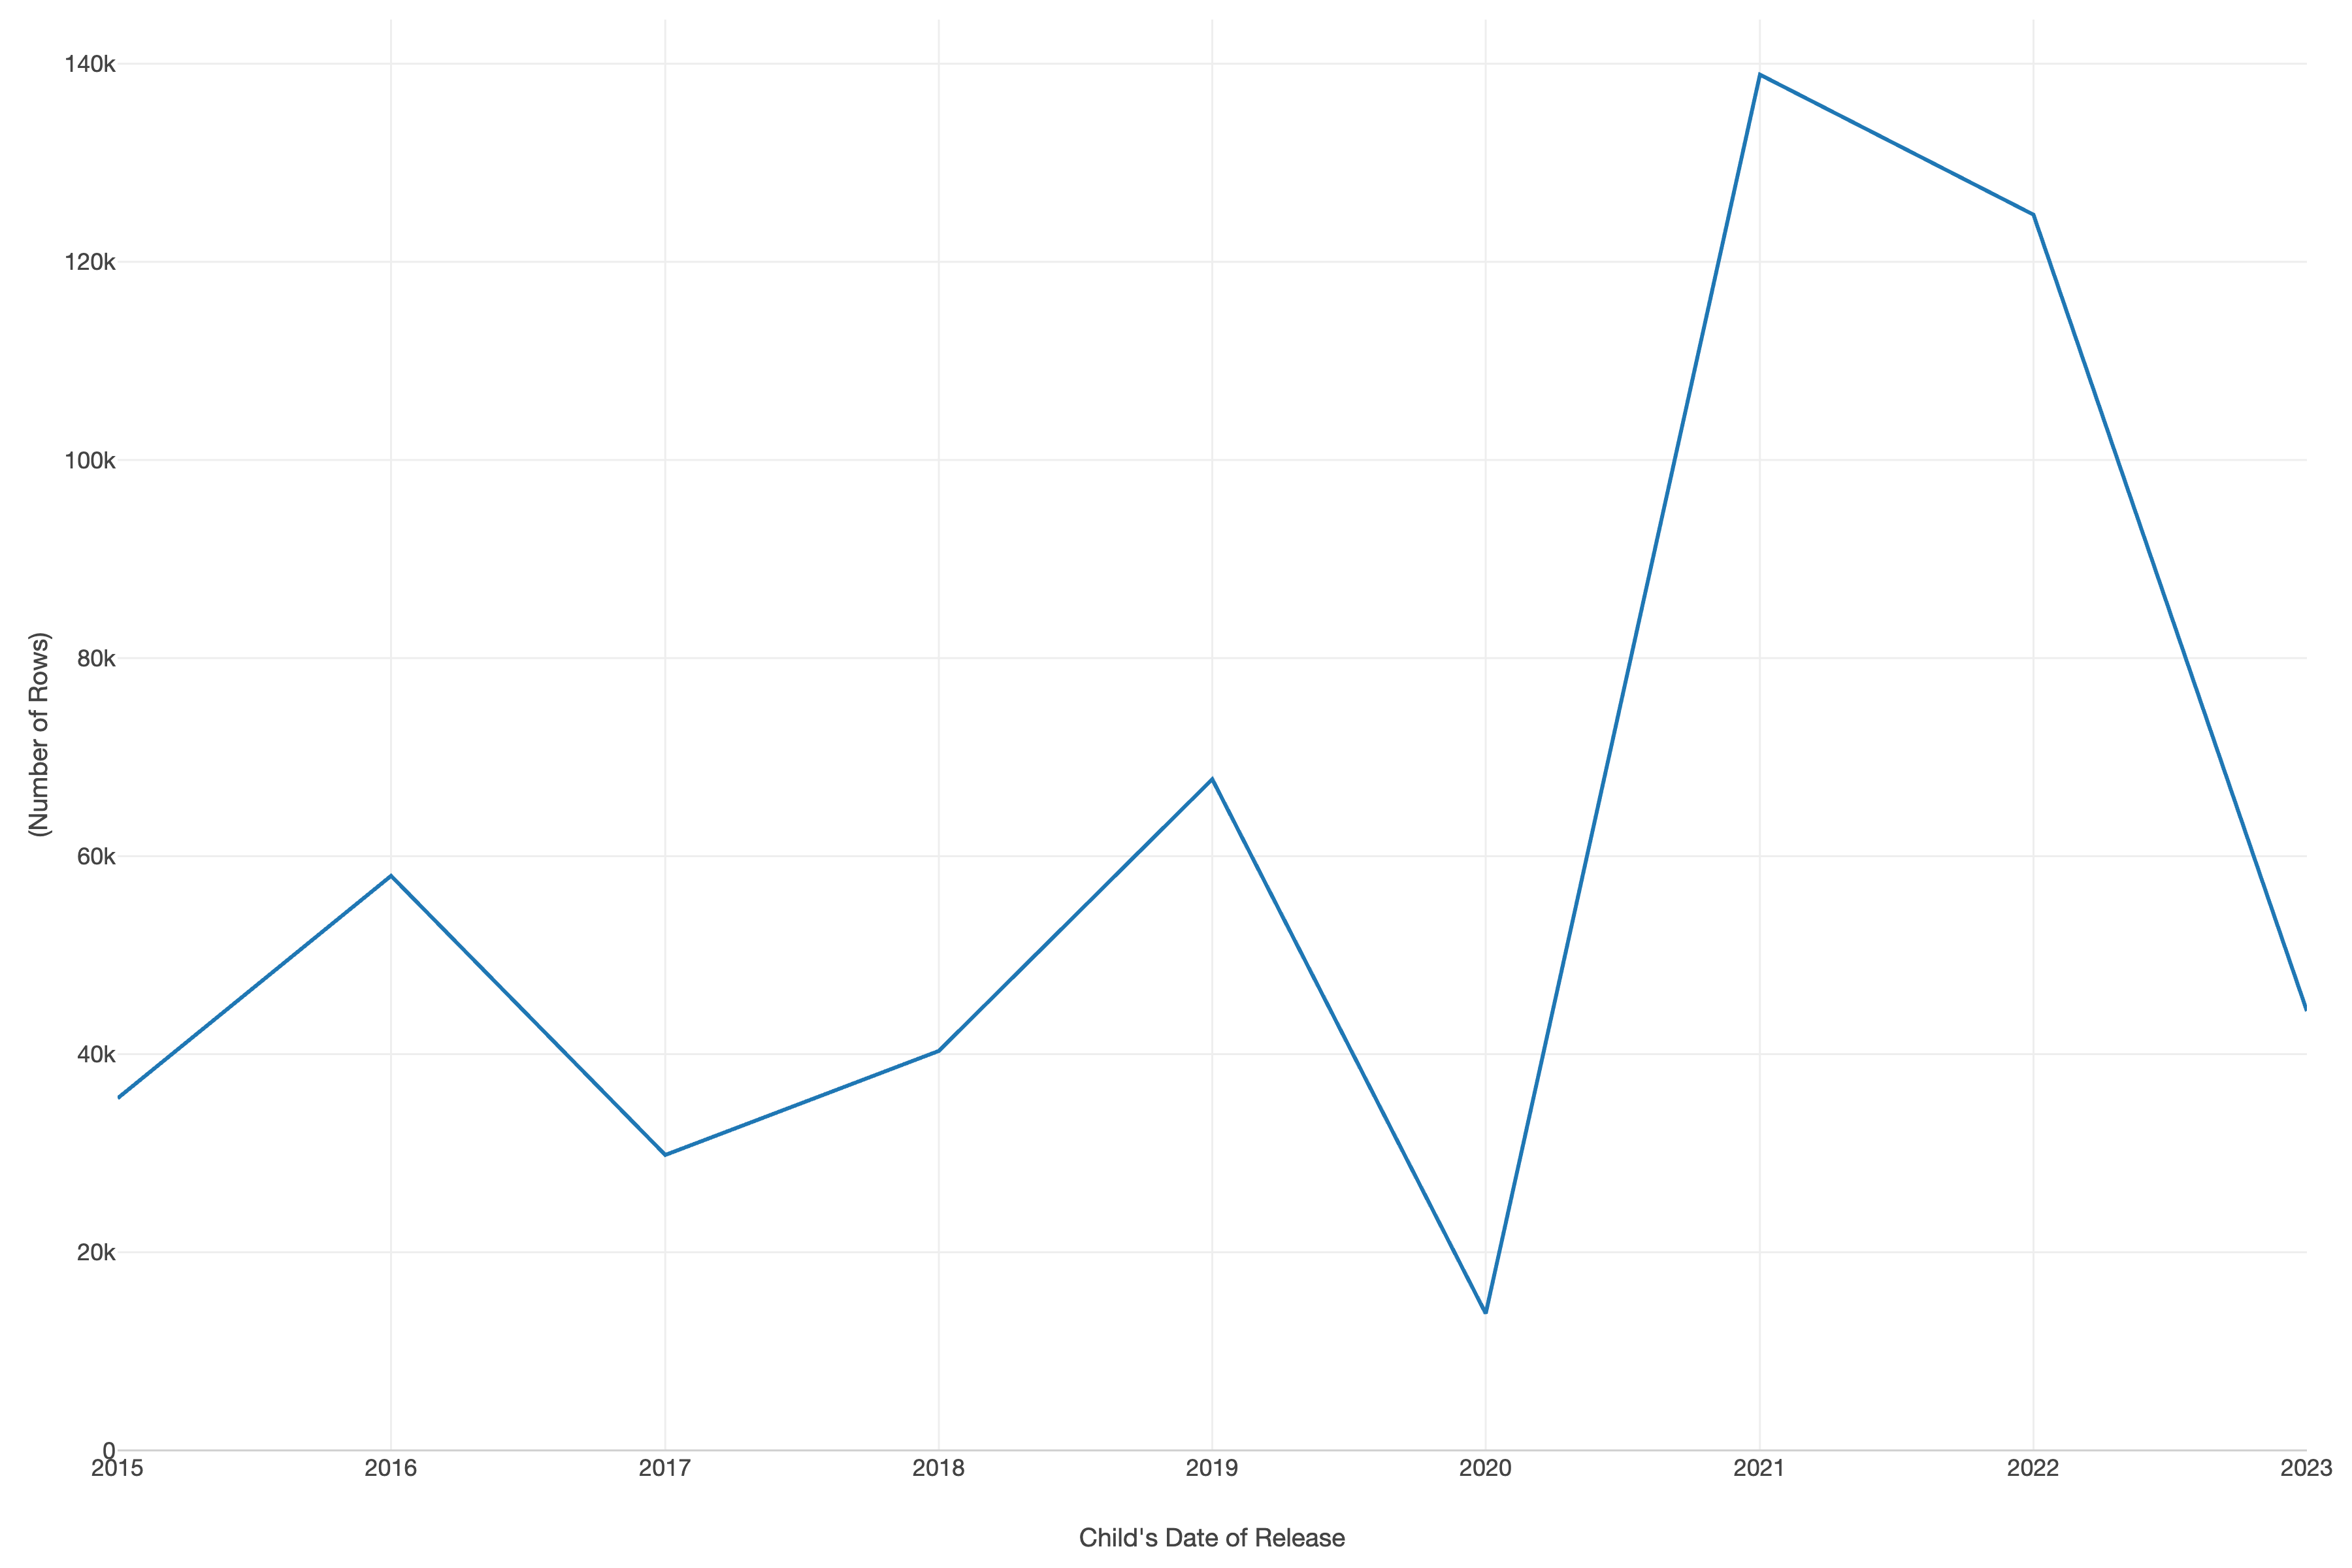
As expected, the number of releases decreases closer to the present. This pattern is expected, as children who arrived more recently are likely still in custody.
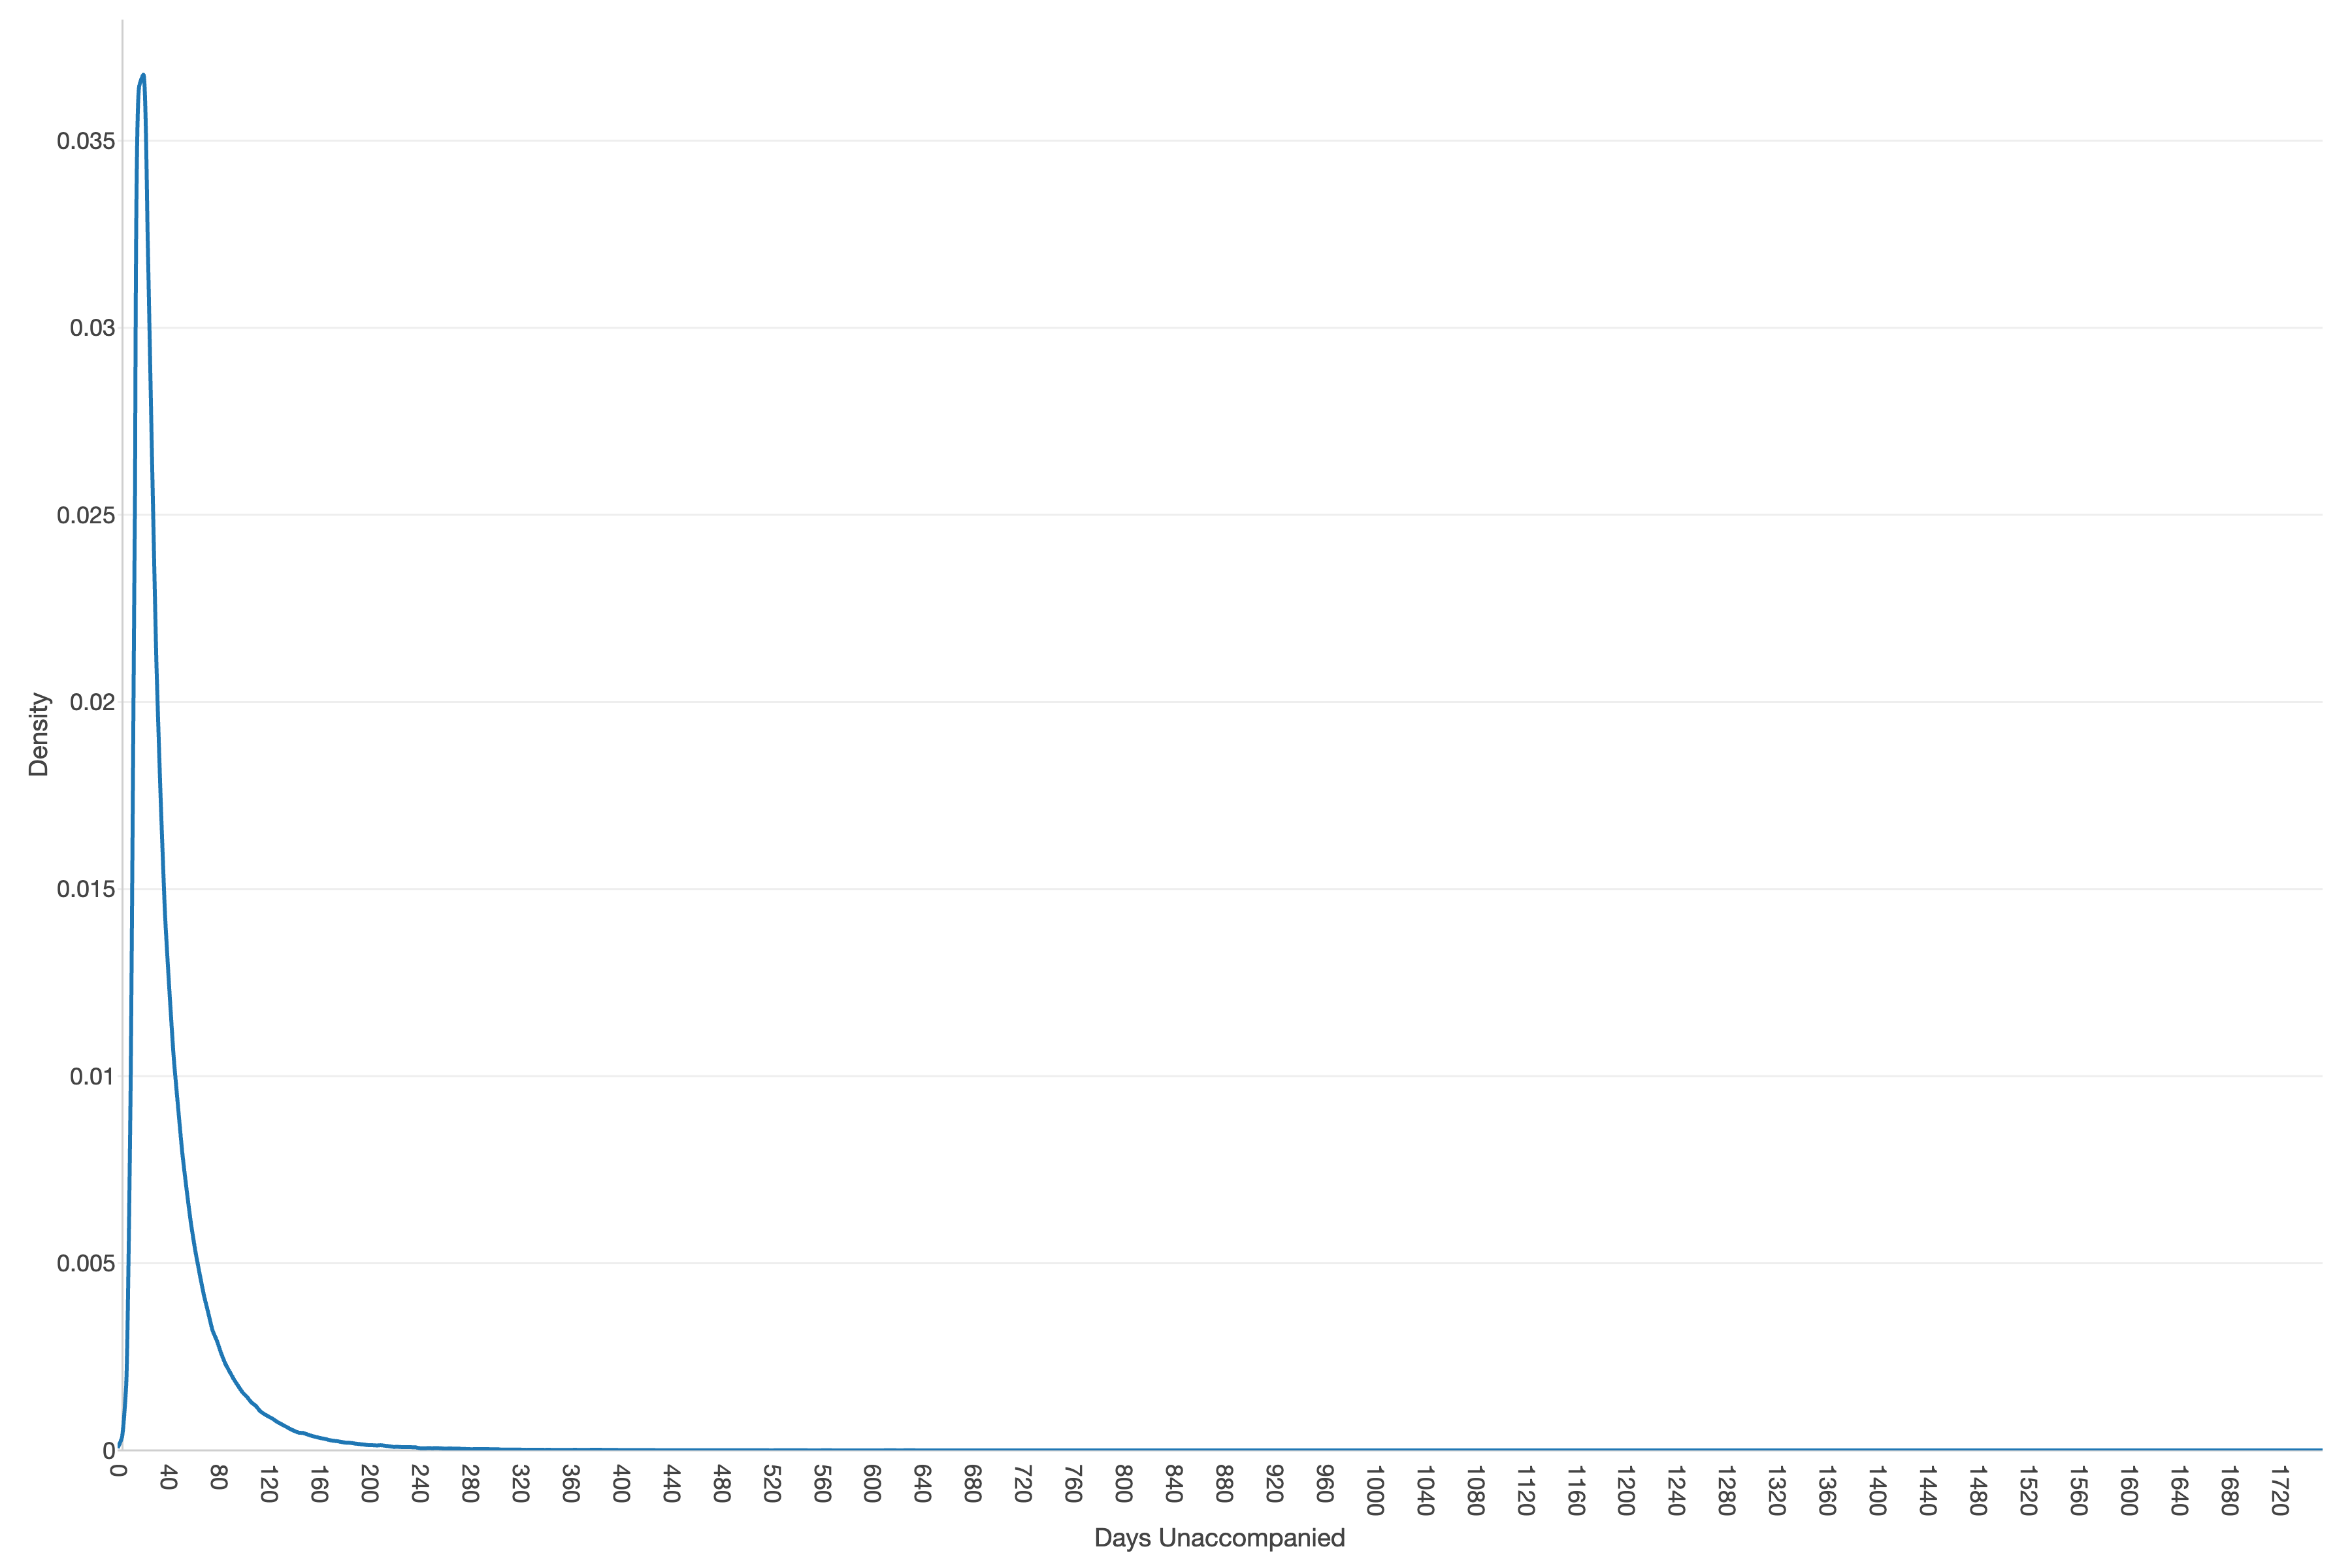
It is concerning to see that some children have been in custody for extended periods, with a few cases spanning over three years. This prolonged detention can have severe psychological and developmental impacts. Luckily, the histogram shows that the data is heavily right-skewed, indicating that most children are released within a shorter timeframe.
Date of Entry by Sponsor Category
! Line chart showing date of entry broken down by sponsor category
There are four main sponsor categories: immediate relatives, parent or legal guardians, unrelated adult individuals, and unknown. Analyzing the date of entry by sponsor category reveals interesting patterns. Immediate relatives and parents or legal guardians consistently account for most sponsors across the years. However, there has been a large spike in the number of unrelated adult individuals sponsoring unaccompanied children in recent years.
Regression Analysis of Days Unaccompanied
To observe what factors influenced the number of days unaccompanied children spend in U.S. custody, I conducted a regression analysis using the available variables in the dataset. The regression model included factors such as gender, country of origin, and sponsor category. Examining these variables’ coefficients and significance levels reveals which factors strongly impact the duration of a child’s stay in custody. The analysis below shows that the highest predictor is sponsorship by a first cousin or unrelated adult, followed by uncles and aunts.
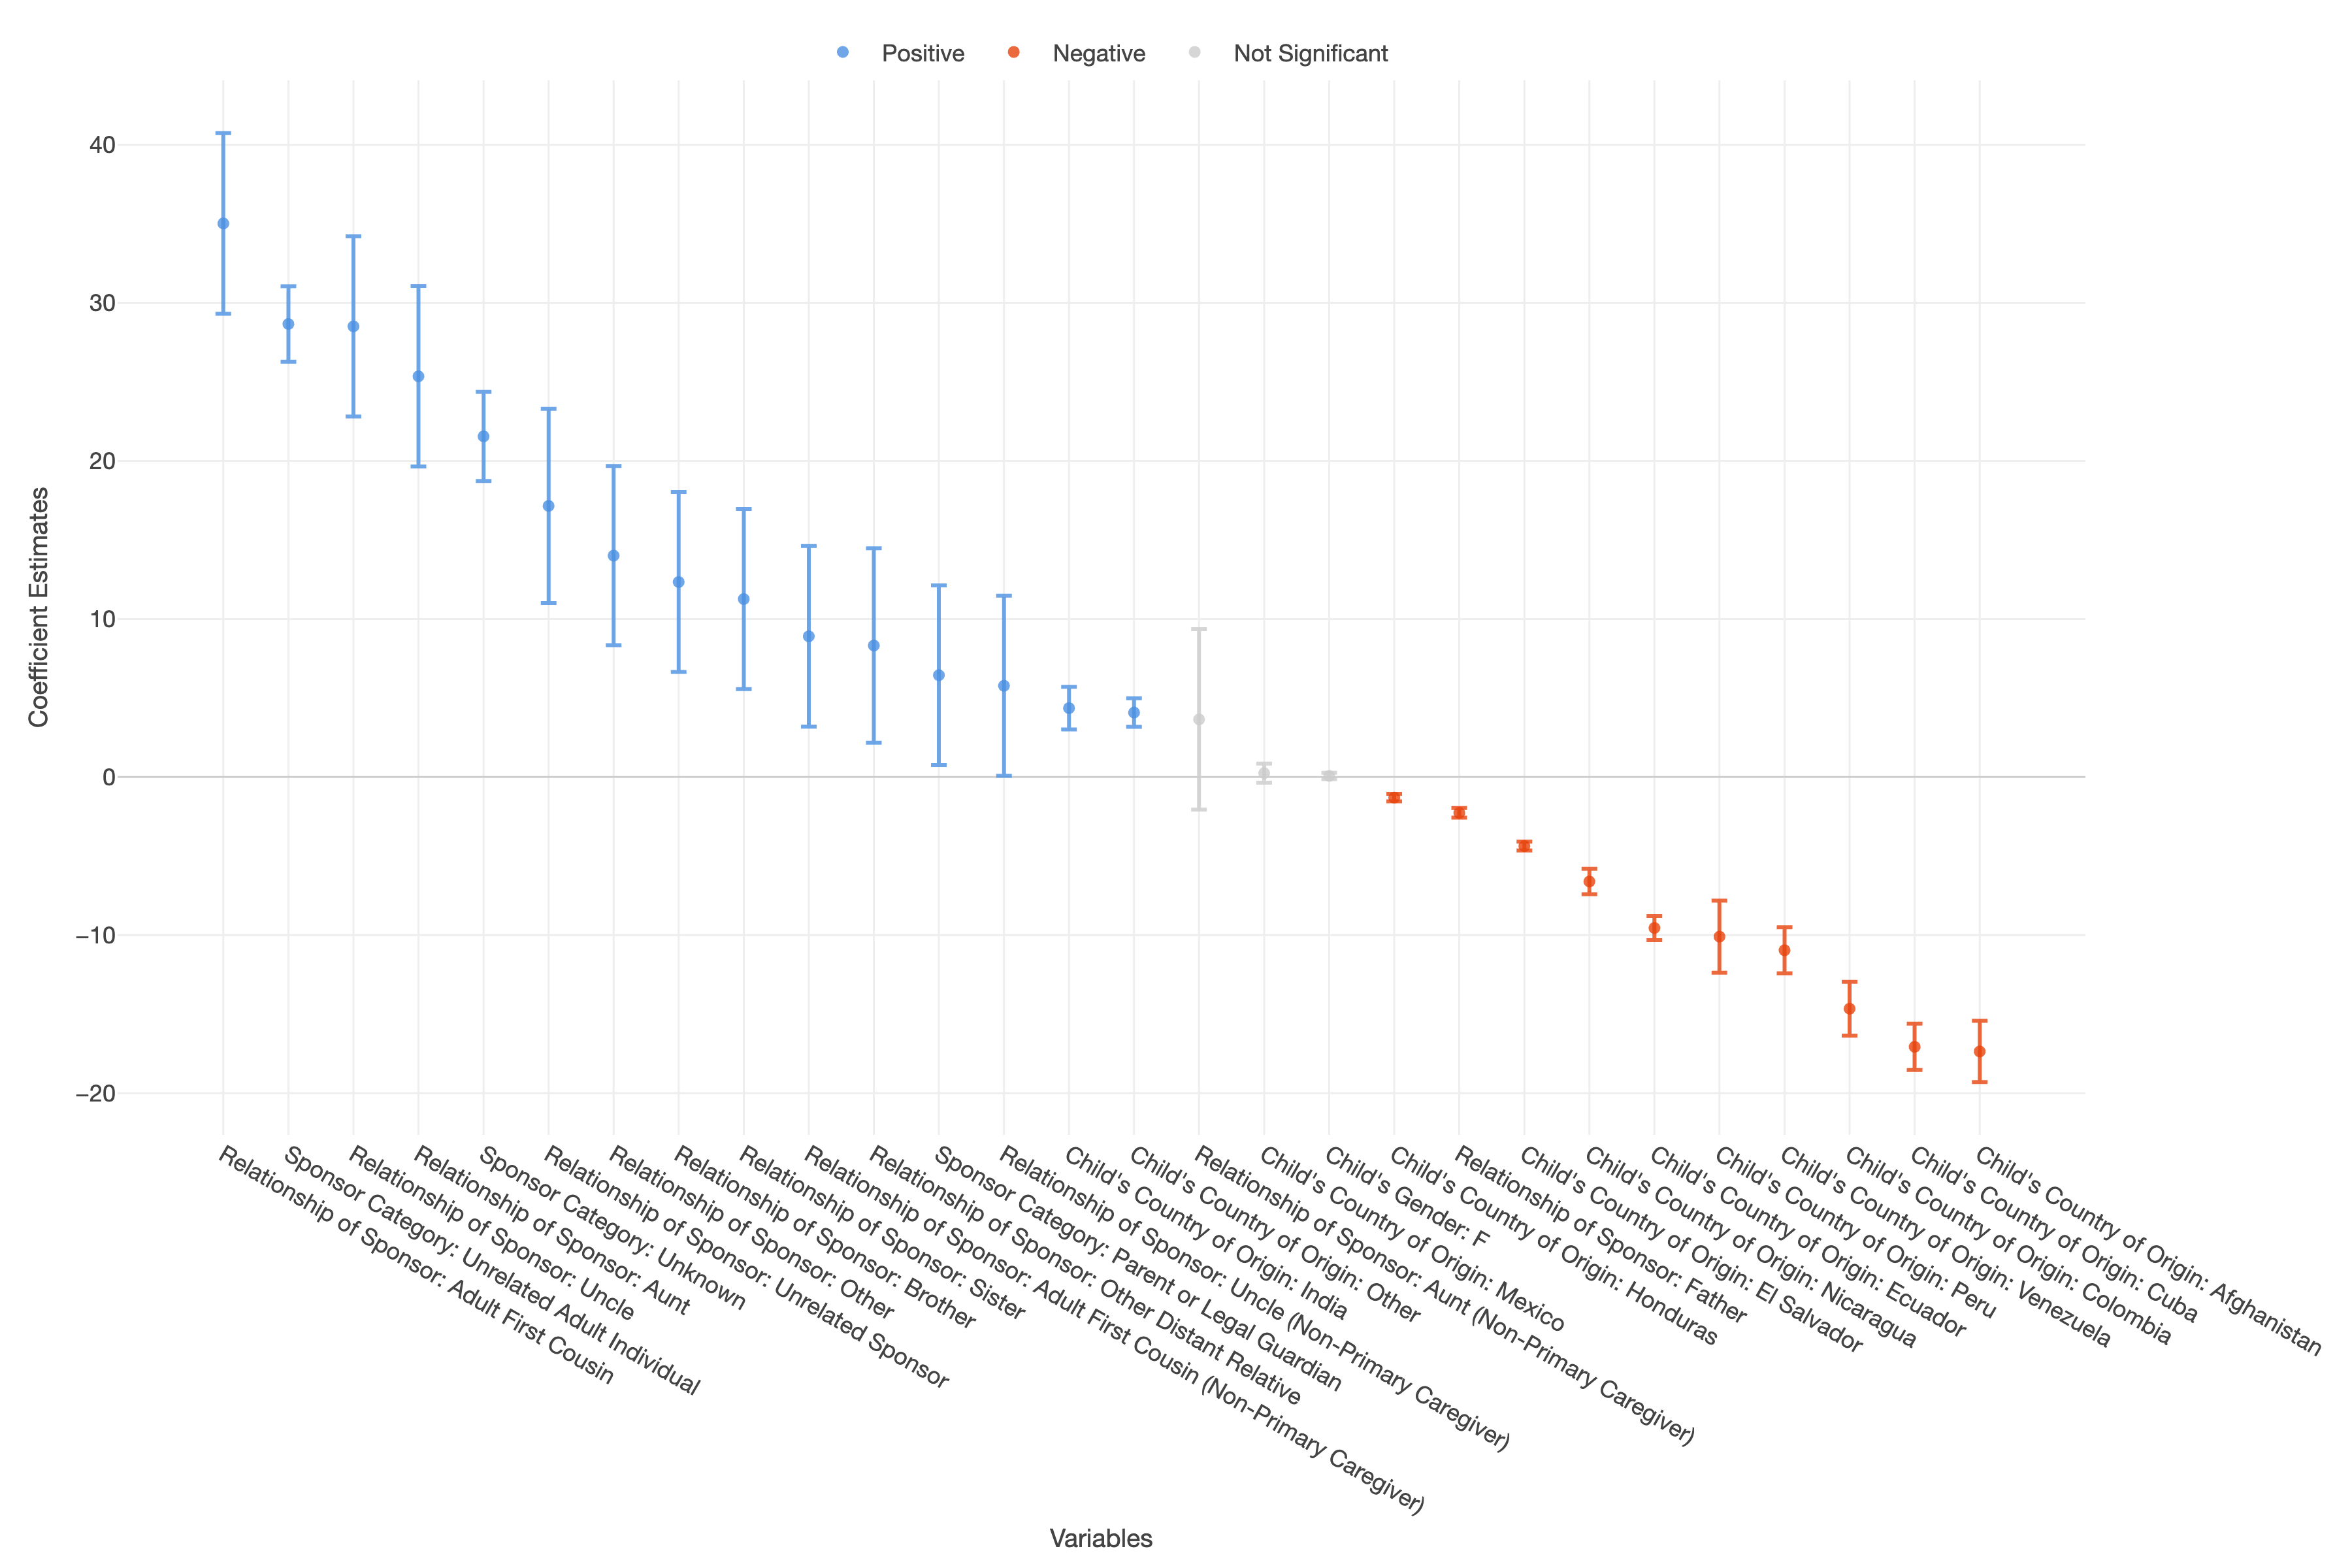
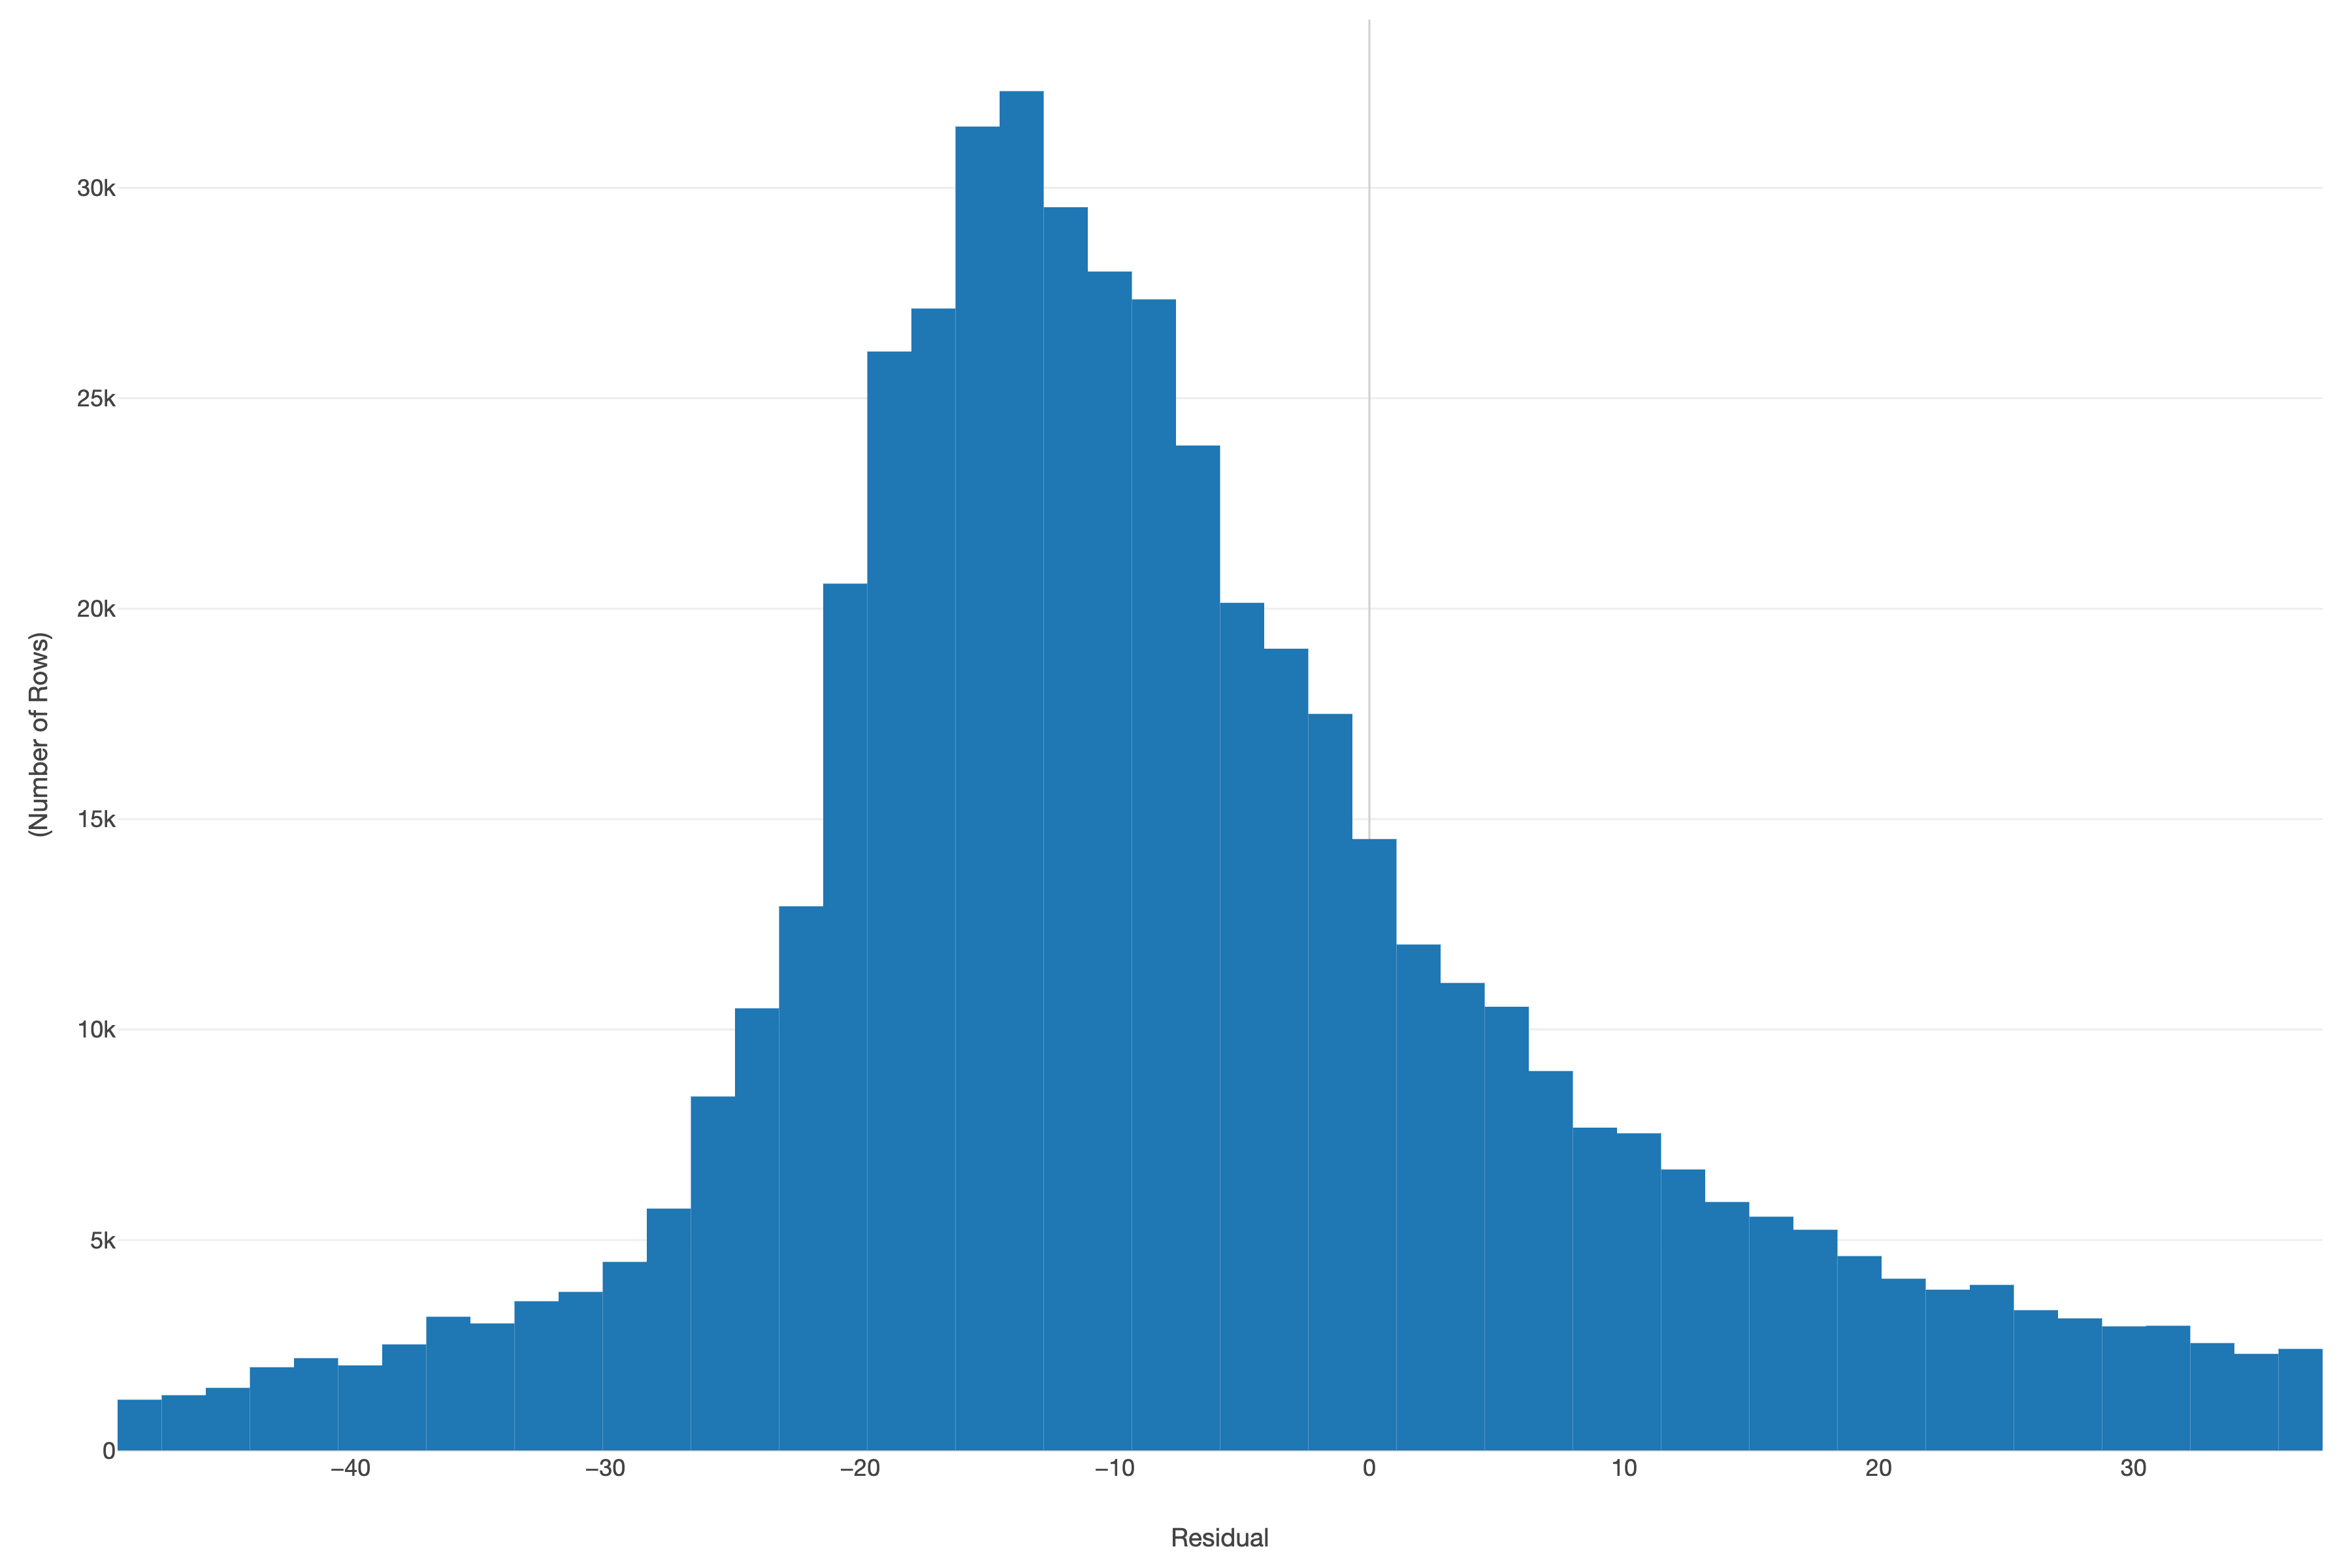
It would probably be better to do a mixed model given that there are likely hierarchical effects, such as country of origin. However, the residuals show a fairly normal distribution.
! Histogram of regression residuals, showing a roughly normal distribution centered around zero
Overall, the model gives us an adjusted R-squared of about 12%.
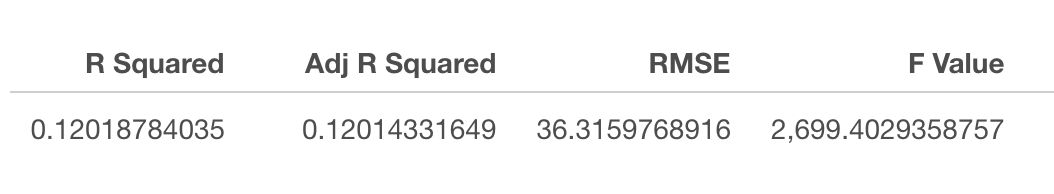
This indicates that while the included variables explain variations in the number of days unaccompanied children spend in custody, other important factors are likely not captured in the dataset. Further research and data collection efforts could help identify additional variables that contribute to the length of stay, such as the child’s age, mental health, and the efficiency of the legal processes involved in their case.
This dataset still has a lot of interesting information that I have not yet explored. I would also like to create a searchable database for individuals who may be interested in finding specific cases or understanding the experiences of unaccompanied children from their country of origin. Since the dataset provides data about zip codes and countries of origin, this would allow others to see if there are unaccompanied children in their local communities.