Convolutional Neural Networks and HDBSCAN for Tagging Handwritten Archival Material
Handwritten archival materials present a unique challenge for automated tagging and categorization, as traditional optical character recognition (OCR) techniques often struggle with their variability and complexity. Consequently, documents typically require manual tagging and categorization by human archivists—a time-consuming and labor-intensive process. This issue is compounded by the fact that historical documents often use scripts or writing styles unfamiliar to contemporary students. Since cursive is rarely taught now, younger generations may need specific training to read certain historical documents. While transformer models show promise in transcribing handwritten text, they require large amounts of labeled training data, which is often unavailable for historical documents. Convolutional neural networks (CNNs) offer a promising alternative. By learning visual features directly from handwritten images, CNNs can potentially categorize and tag documents without requiring full transcription.
To examine this, I looked at the handwritten materials currently being collected by the Mississippi Civil War and Reconstruction Governor’s Project, led by Susannah J. Ural at Mississippi State University and Lindsey R. Paterson at the University of South Dakota. The Mississippi Department of Archives and History has been amassing a vast collection of handwritten letters sent to the state’s governors by citizens since 1902. This extensive archive, spanning over a century, contains almost 20,000 letters dating back to 1859. Students have been diligently working on transcribing the letters manually, and while this process is time-consuming, it provides a unique opportunity to test for accuracy.
When this analysis was conducted, approximately 7,850 documents were available online; the publicly accessible archive has since grown to almost 11,800 documents. The documents span various topics, from personal correspondence to official government communications. As part of the CWRGM project, documents are carefully transcribed and tagged with metadata like date, sender, recipient, and subject matter. Using PixPlot, I created a visual overview of the collection available at the time. PixPlot uses a CNN to extract visual features from each image and then projects those features into a 2D space using UMAP for dimensionality reduction. It then utilizes Hierarchical Density-Based Spatial Clustering of Applications with Noise (HDBSCAN) to identify clusters within the projected space. These clusters can potentially reveal patterns and groupings within the collection not immediately apparent from the metadata alone.
Explore the PixPlot visualization of the CWRGM documents.
By exploring the PixPlot visualization, I noticed several distinct clusters of visually similar documents.
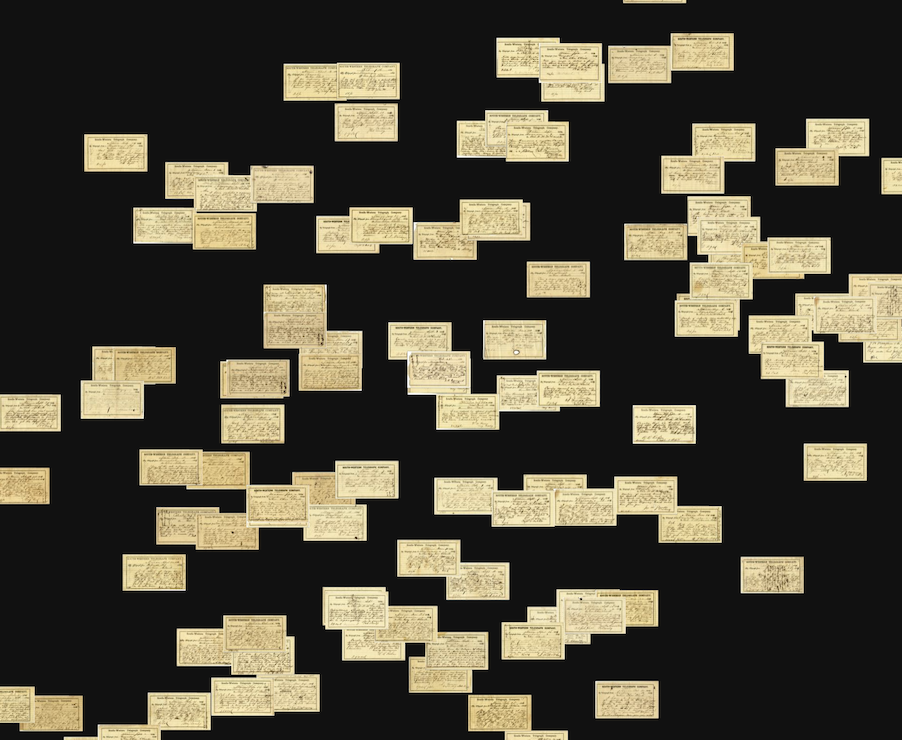
Telegrams in Cluster 6
One cluster, labeled Cluster 6, contained a significant number of telegrams. The telegrams in this cluster were characterized by their brief, condensed language, and standardized formatting, typically including the date, sender, and recipient information at the top of the document, followed by the message itself.
! Examples of telegrams found in Cluster 6 of the PixPlot visualization
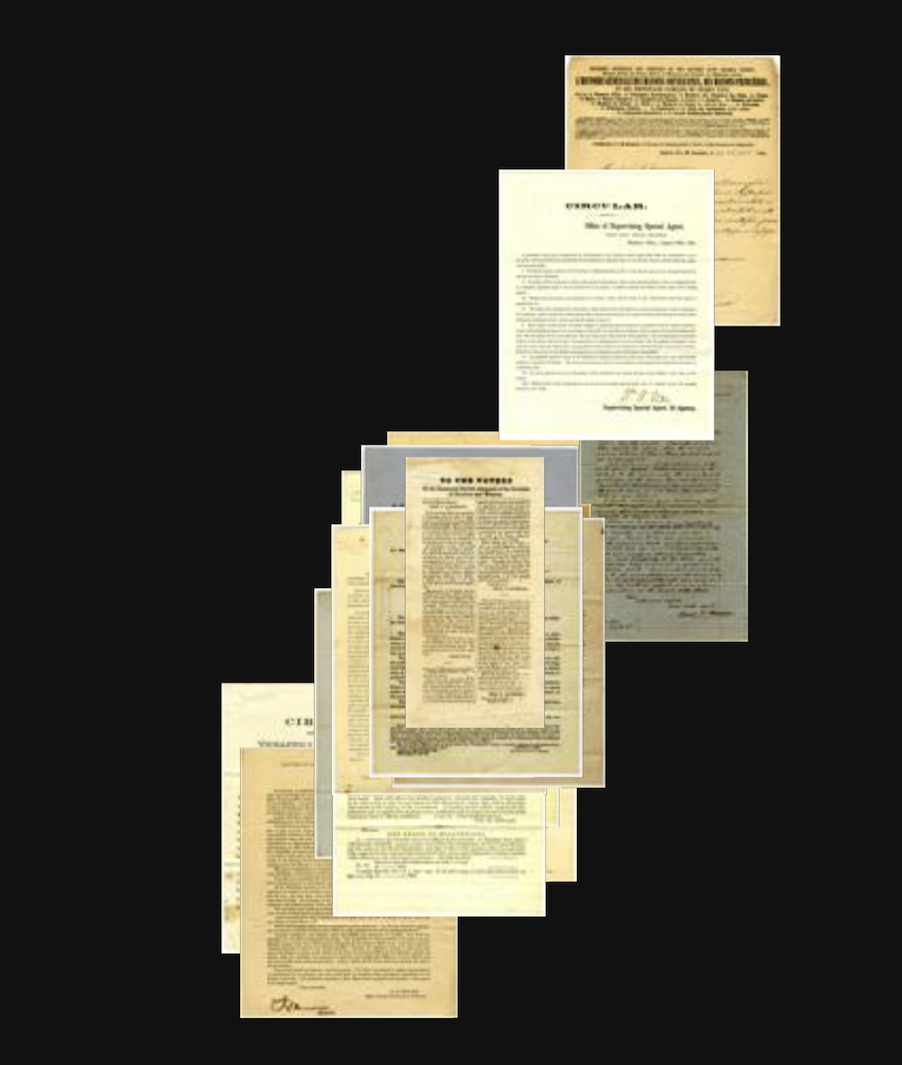
Printed Letters in Cluster 7
Another visually distinct cluster, labeled Cluster 7, contained a high concentration of printed letters. These letters were likely produced using a typewriter or printing press, evidenced by their uniform typography and layout. The presence of printed letters suggests that not all communications were handwritten and that some individuals or organizations had access to more advanced writing technologies. This cluster also demonstrates the CNN’s ability to effectively distinguish between handwritten and printed documents based purely on visual features.
! Examples of printed letters found in Cluster 7 of the PixPlot visualization
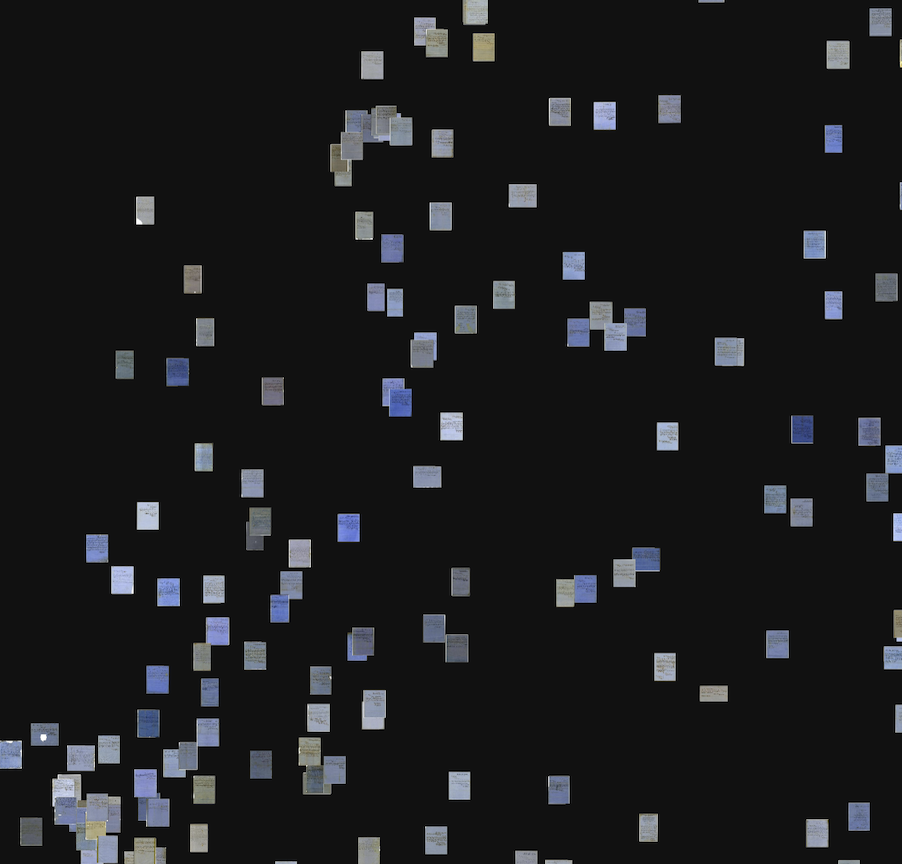
Blue Color Letters in Cluster 8
Cluster 8 contained a notable subset of letters written on blue-colored paper. The CNN grouped these letters based on their distinctive color, showcasing its ability to identify and cluster documents using visual characteristics beyond typography alone. The use of blue paper might indicate a specific type of correspondence or a period when this color was more common. Further analysis is needed.
! Examples of letters written on blue paper found in Cluster 8 of the PixPlot visualization
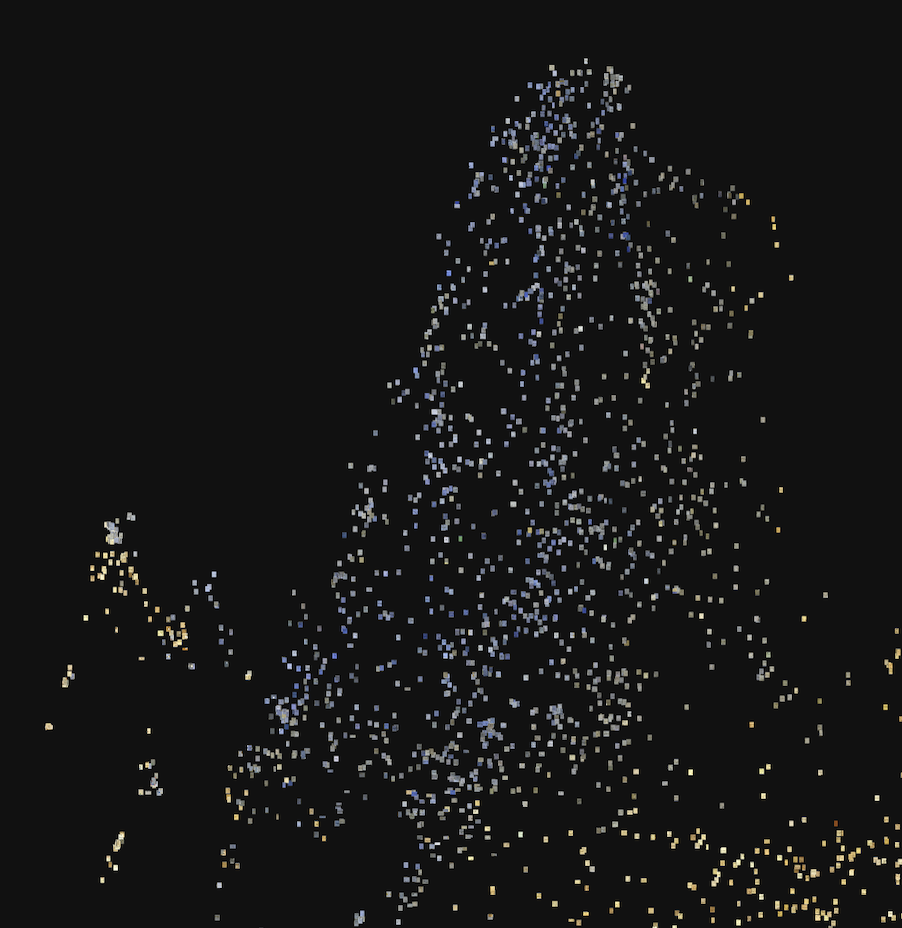
Notably, all blue-colored letters were grouped by UMAP near the top of the visualization. This spatial grouping suggests that the use of blue paper wasn’t evenly distributed throughout the collection but concentrated within a specific subset of documents.
! UMAP projection showing blue-colored letters clustered together at the top of the visualization