ImageSpace: Using AI to Visualize Large Image Collections in the Browser
ImageSpace uses AI to turn any image collection into an interactive scatter plot. OpenAI's CLIP vision model generates embeddings, t-SNE arranges them by visual similarity, and HDBSCAN clusters them automatically—all viewable in the browser with no backend required.
Why Another Visualization Tool?
A few years ago, Yale’s DHLab released PixPlot, a fantastic tool for analyzing large image collections. In my own research, I used it to determine if handwritten archival materials could find meaningful clusters.. But PixPlot depends on TensorFlow 1.x, Python 2-era libraries, and a custom WebGL renderer that hasn’t been updated in years, so installing it today is an extremely uphill battle.
ImageSpace is a ground-up rewrite of PixPlot, and you can see a demo of it here with 49,585 WikiArt paintings. It achieves the same core goal as PixPlot—visualizing large image datasets as interactive scatter plots—but replaces the entire stack with modern AI and rendering:
- OpenAI’s CLIP vision-language model (run locally via ONNX Runtime) generates embeddings that capture what images look like and what they mean. These replace InceptionV3 and are far better at grouping images by semantic and stylistic similarity.
- HDBSCAN finds natural groupings in the embedding space, then CLIP’s zero-shot classification labels each cluster automatically so you don’t have to do manual tagging.
- PixiJS 8 with WebGL2 replaces the custom Three.js renderer — stable, well-maintained, and fast enough for 50K+ sprites at ~30 FPS.
The viewer is a single-page React app rendered entirely with PixiJS. It loads the precomputed layout, metadata, and atlas textures, then draws every image as a sprite on a pannable, zoomable canvas. There is no backend or database. The Python pipeline produces a folder of files; you open index.html and everything loads in the browser.
Four Ways to Look at Your Data
ImageSpace provides four view modes, each useful for different questions:
-
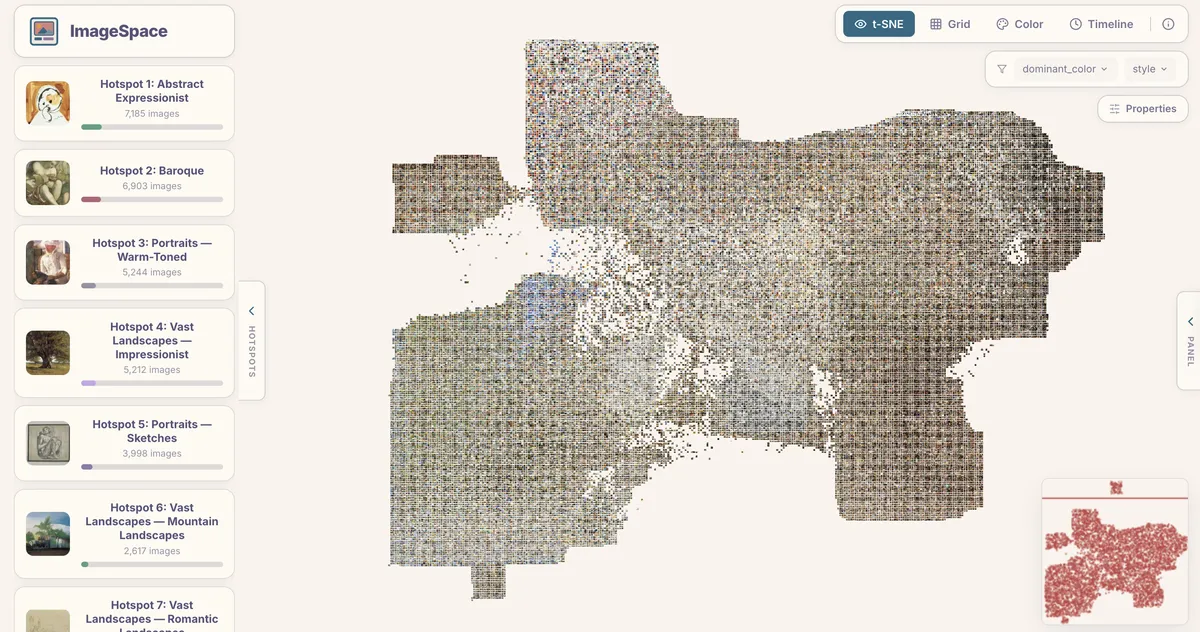
t-SNE arranges images by visual similarity using the CLIP embeddings. Thus, things like portraits drift toward portraits, landscapes toward landscapes, abstracts toward abstracts
-
Grid lays images out in a uniform grid, useful when you want to scan through everything systematically rather than by similarity.
-
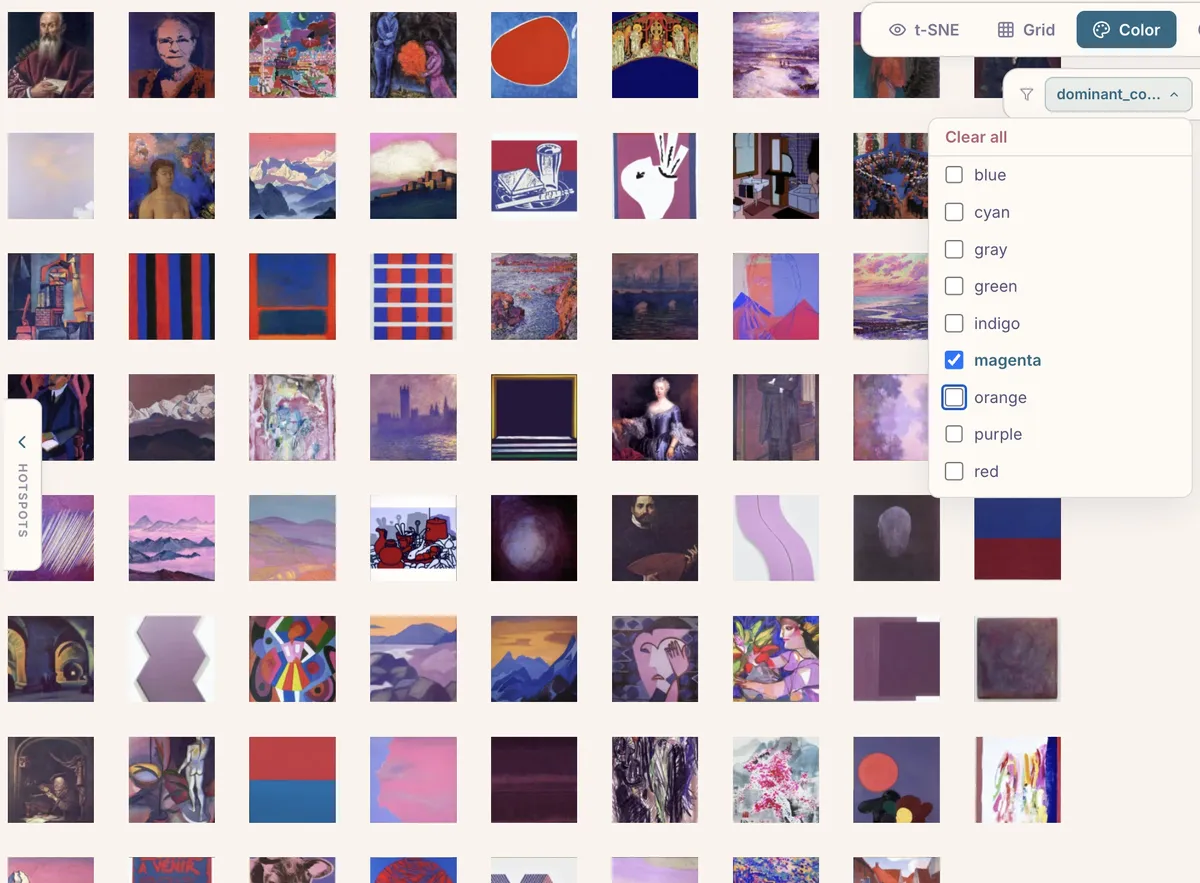
Color sorts images by dominant color along a hue wheel. It’s a surprisingly effective way to spot patterns.
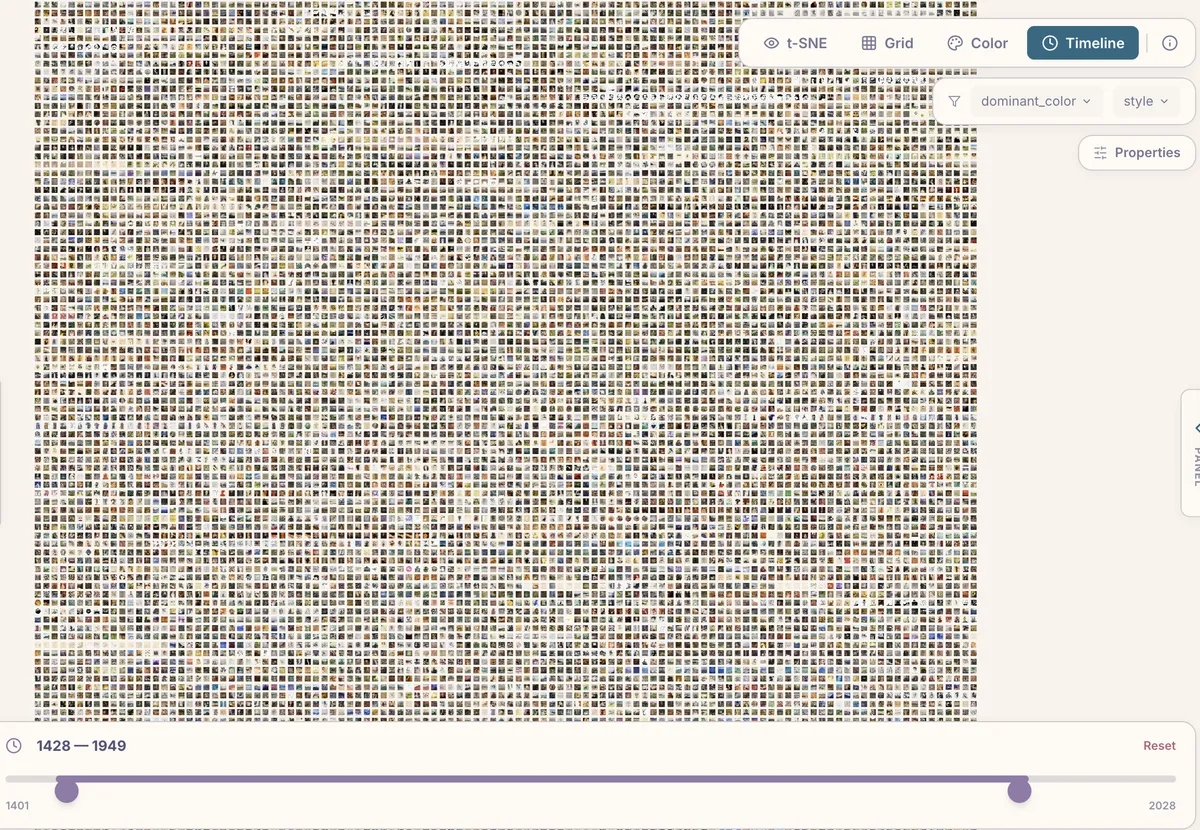
- Timeline arranges images chronologically (if your metadata includes dates), letting you watch visual trends evolve over time.
Filtering and Cluster Hotspots
Any column in your metadata CSV becomes a filter in the viewer. Categorical columns get dropdown checkboxes; numeric columns (including the computed features like brightness and complexity) get range sliders.
The sidebar also shows cluster hotspots — the largest clusters HDBSCAN found, each labeled automatically by CLIP. Clicking a hotspot zooms into that cluster and filters to its members. In the WikiArt demo, for instance, the top clusters include “Abstract Expressionist,” “Baroque,” “Portraits — Warm-Toned,” and “Vast Landscapes — Impressionist.”
Exploring Individual Images
Clicking any image opens a detail panel showing its full metadata — title, artist, style, dimensions, and whatever else your CSV contains. Below the metadata, a similar images strip shows the nearest neighbors in CLIP embedding space. This k-NN lookup is precomputed by the pipeline, so it’s instant in the viewer.
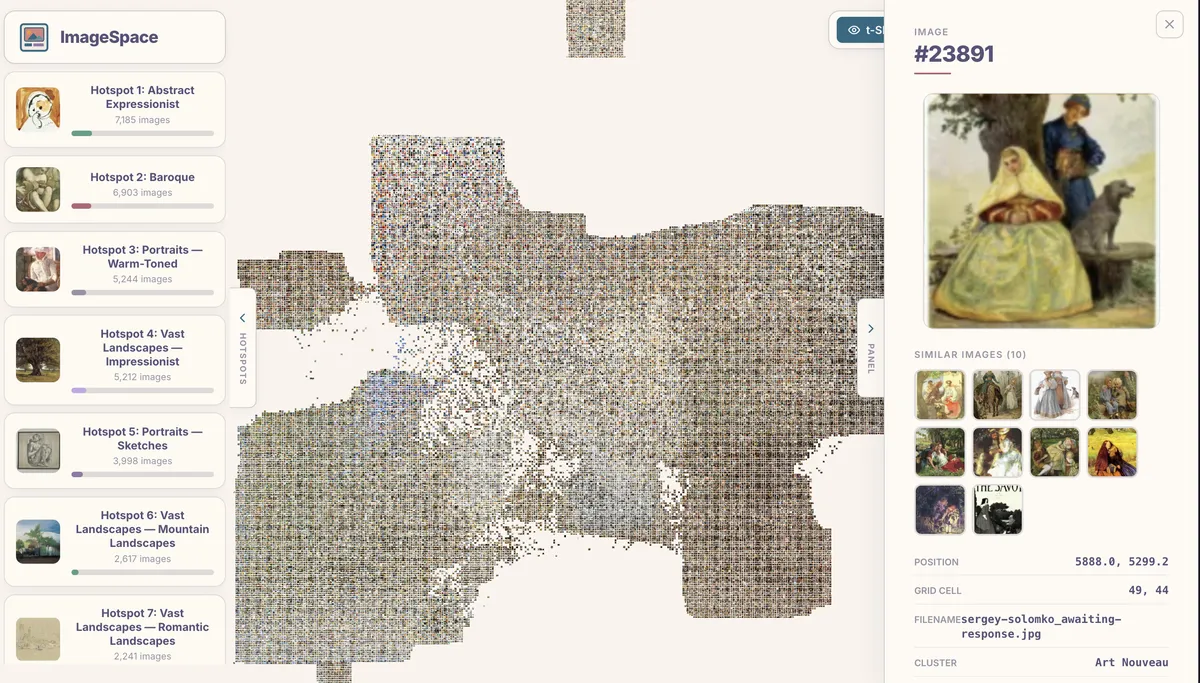
The similar images panel is one of the most useful features for research. It surfaces connections that are often invisible in a traditional image browser.
Progressive Loading
50,000 thumbnail images add up to a lot of data. ImageSpace handles this with a two-phase loading strategy: the viewer first loads the metadata and binary layout (a few hundred KB), renders placeholder positions, then streams atlas textures in parallel. A progress bar shows how many atlases have loaded, and images pop into view as each atlas arrives. A service worker caches everything after the first visit, so subsequent loads are near-instant.
Try It Yourself
The GitHub repository has full setup instructions. The quickest path:
pip install pillow numpy scikit-learn opentsne hdbscan onnxruntime scipy
cd image_space && npm install && cd ..

python3 scripts/imagespace.py /path/to/your/images/ \
  -o image_space/public/data/ \
  --thumb-size 128 --quality 85

cd image_space && npx vite build
# Open output/index.html or serve with any static server
If you’d rather skip local setup entirely, a Google Colab notebook is included in the repository. Upload a ZIP of your images (or mount Google Drive), run all cells, and download a ready-to-host output folder.