Utilizing Time Series Analysis using Facebook's Prophet to Analyze Firearm Permits
The debate over gun ownership and regulation in the United States remains contentious. Arguments often center around interpretations of the Second Amendment, public safety concerns, and the effectiveness of existing policies. To inform these discussions, I thought it would be interesting to dive into the FBI’s National Instant Criminal Background Check System (NICS) data, as compiled by the Data Liberation Project. NICS was mandated by the Brady Handgun Violence Prevention Act of 1993 and launched by the FBI in 1998. It’s used by Federal Firearms Licensees (FFLs) to determine whether a prospective buyer is eligible to purchase firearms or explosives.
The NICS data is often used as a proxy for gun sales. However, it’s important to note that it represents the number of background checks initiated, not the number of firearms sold. Various factors, such as differences in state laws and the exclusion of private sales, mean that there isn’t a perfect one-to-one correlation between background checks and gun sales. I downloaded the data in May 2024, which you can explore here. However, because the data for 2024 is still incoming, I decided to filter it to December 2023.
Permit Checks
To begin our analysis, let’s look at the top 10 states with the highest number of permit checks in the most recent year of data. Some states use these permit checks as an alternative to the standard NICS background check process. As we can see, Illinois and Pennsylvania are the top two states on the list, with Illinois being significantly higher than any other state. This is likely due to Illinois’s Firearm Owners Identification (FOID) card system, which requires all firearm owners to obtain a permit before purchasing or possessing firearms.
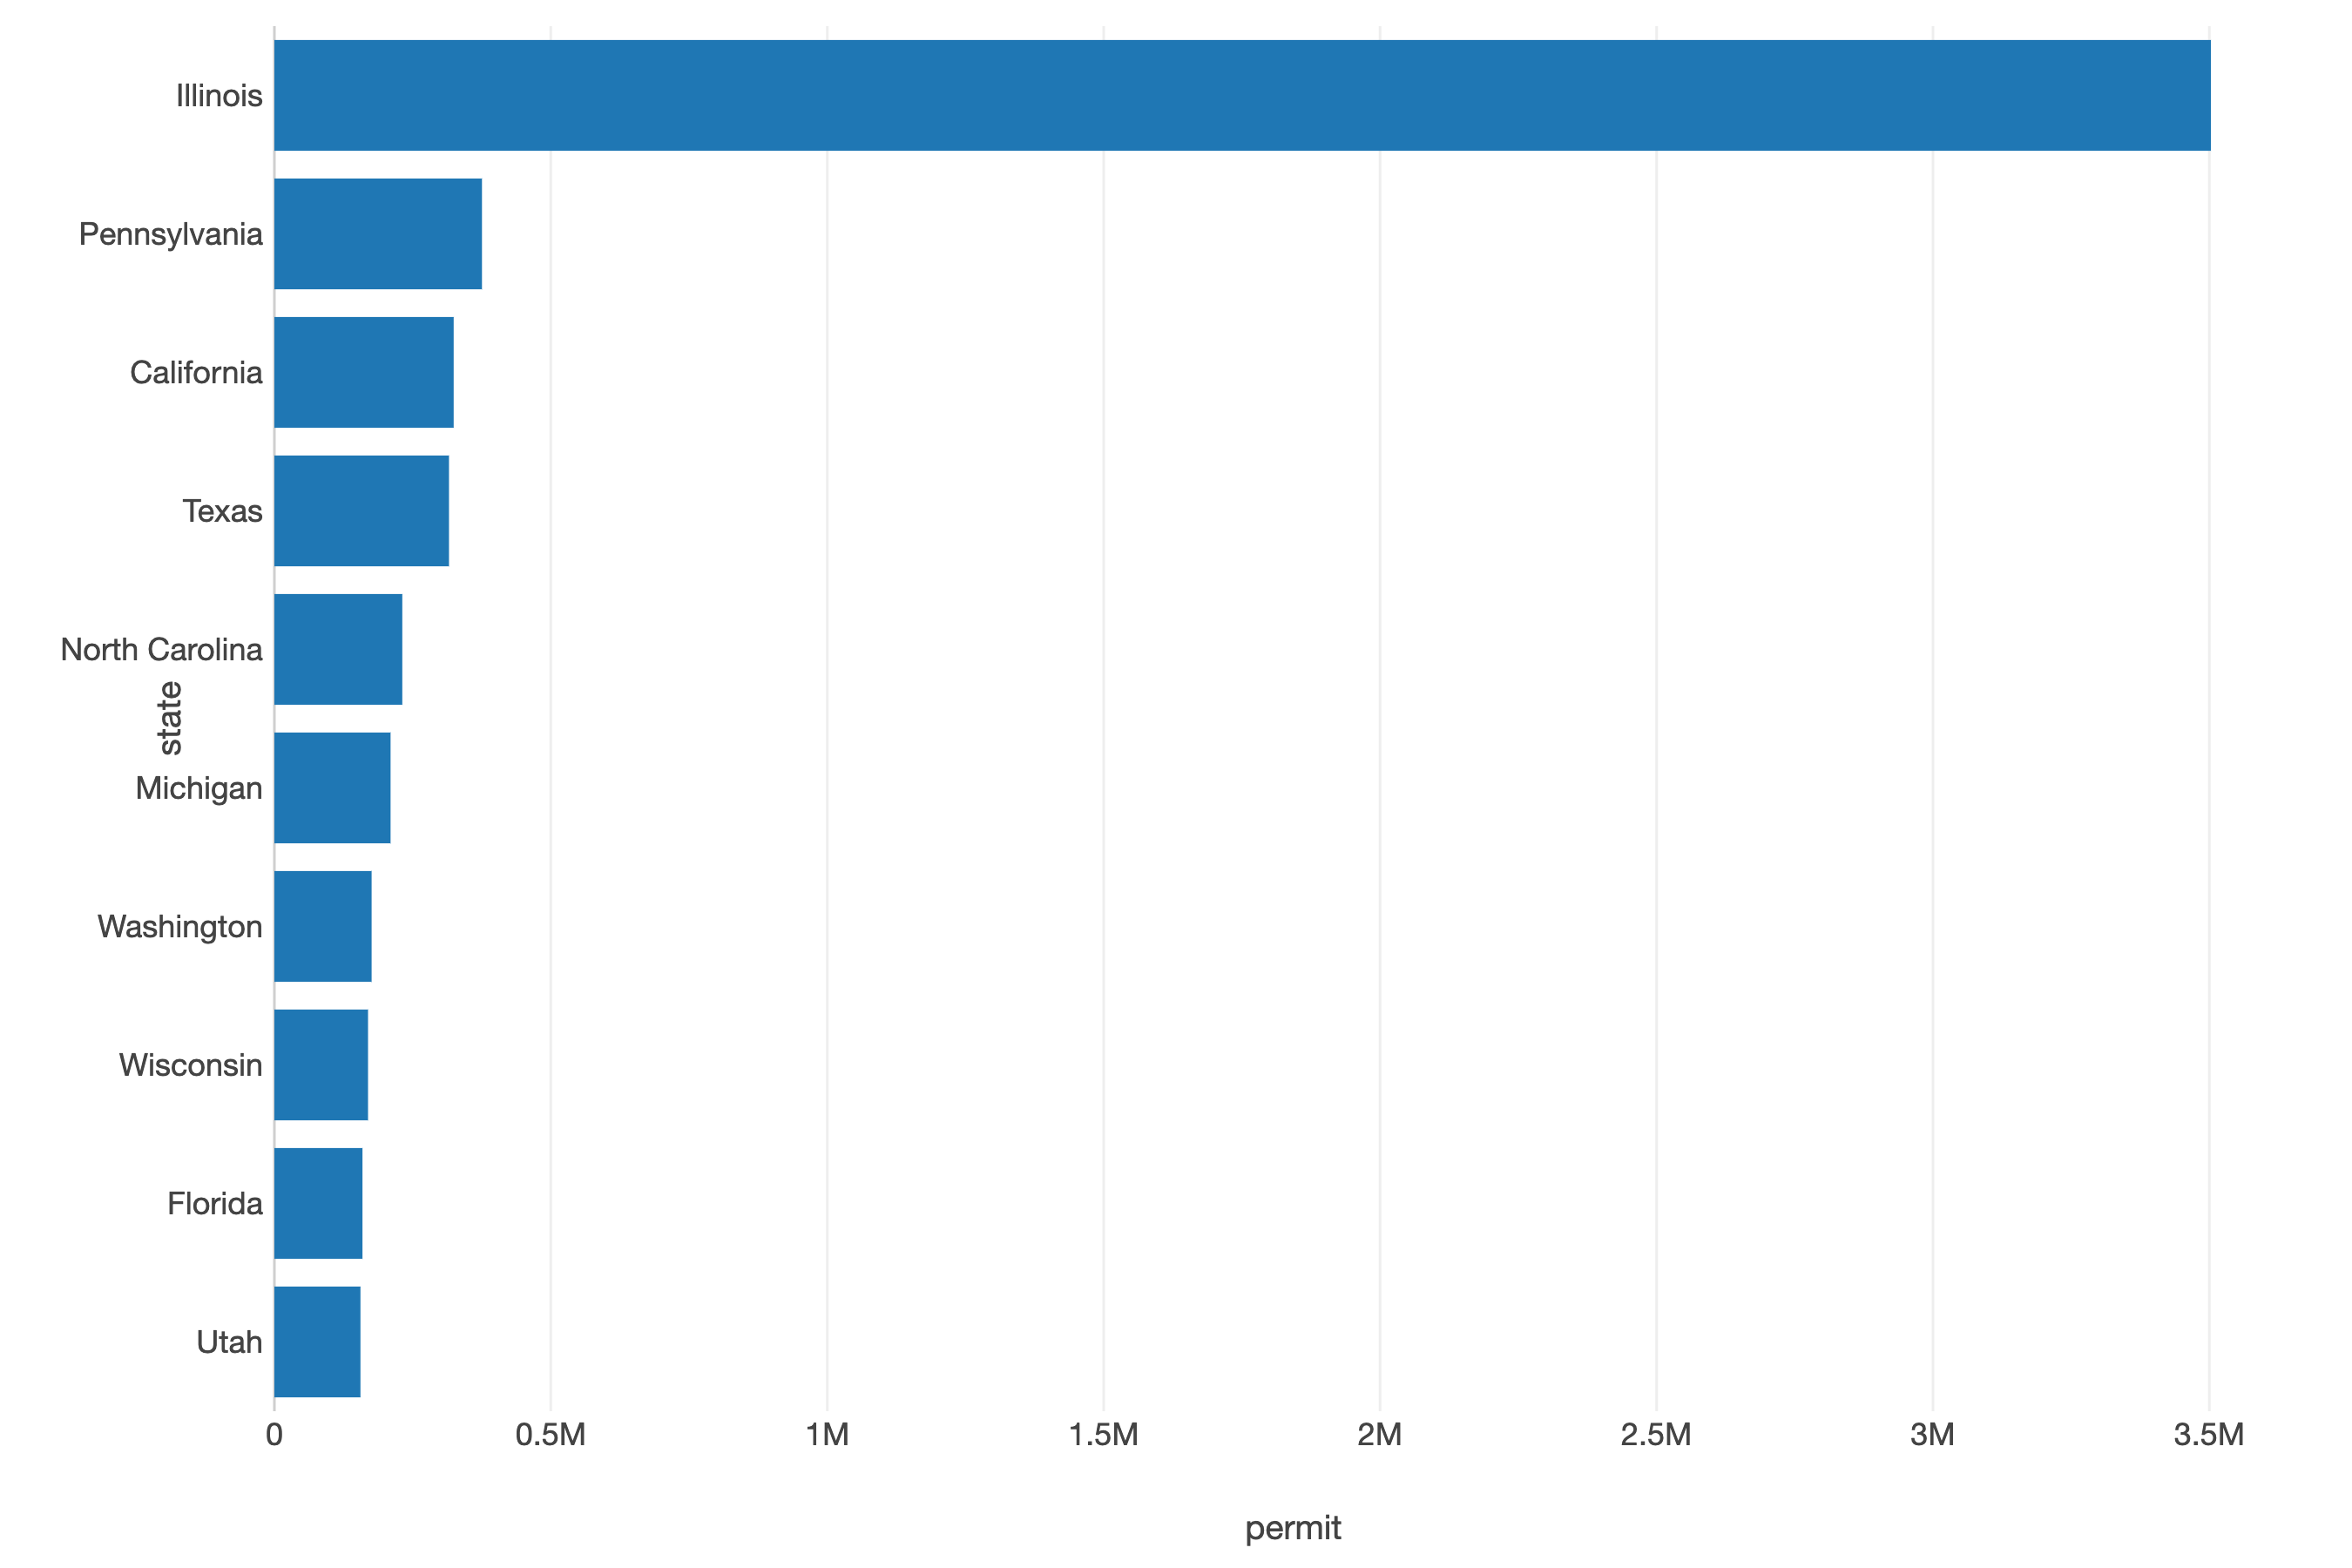
What we find here is that a state’s presence on this list doesn’t necessarily indicate higher overall gun ownership rates; it may simply reflect differences in the background check process and reporting requirements.
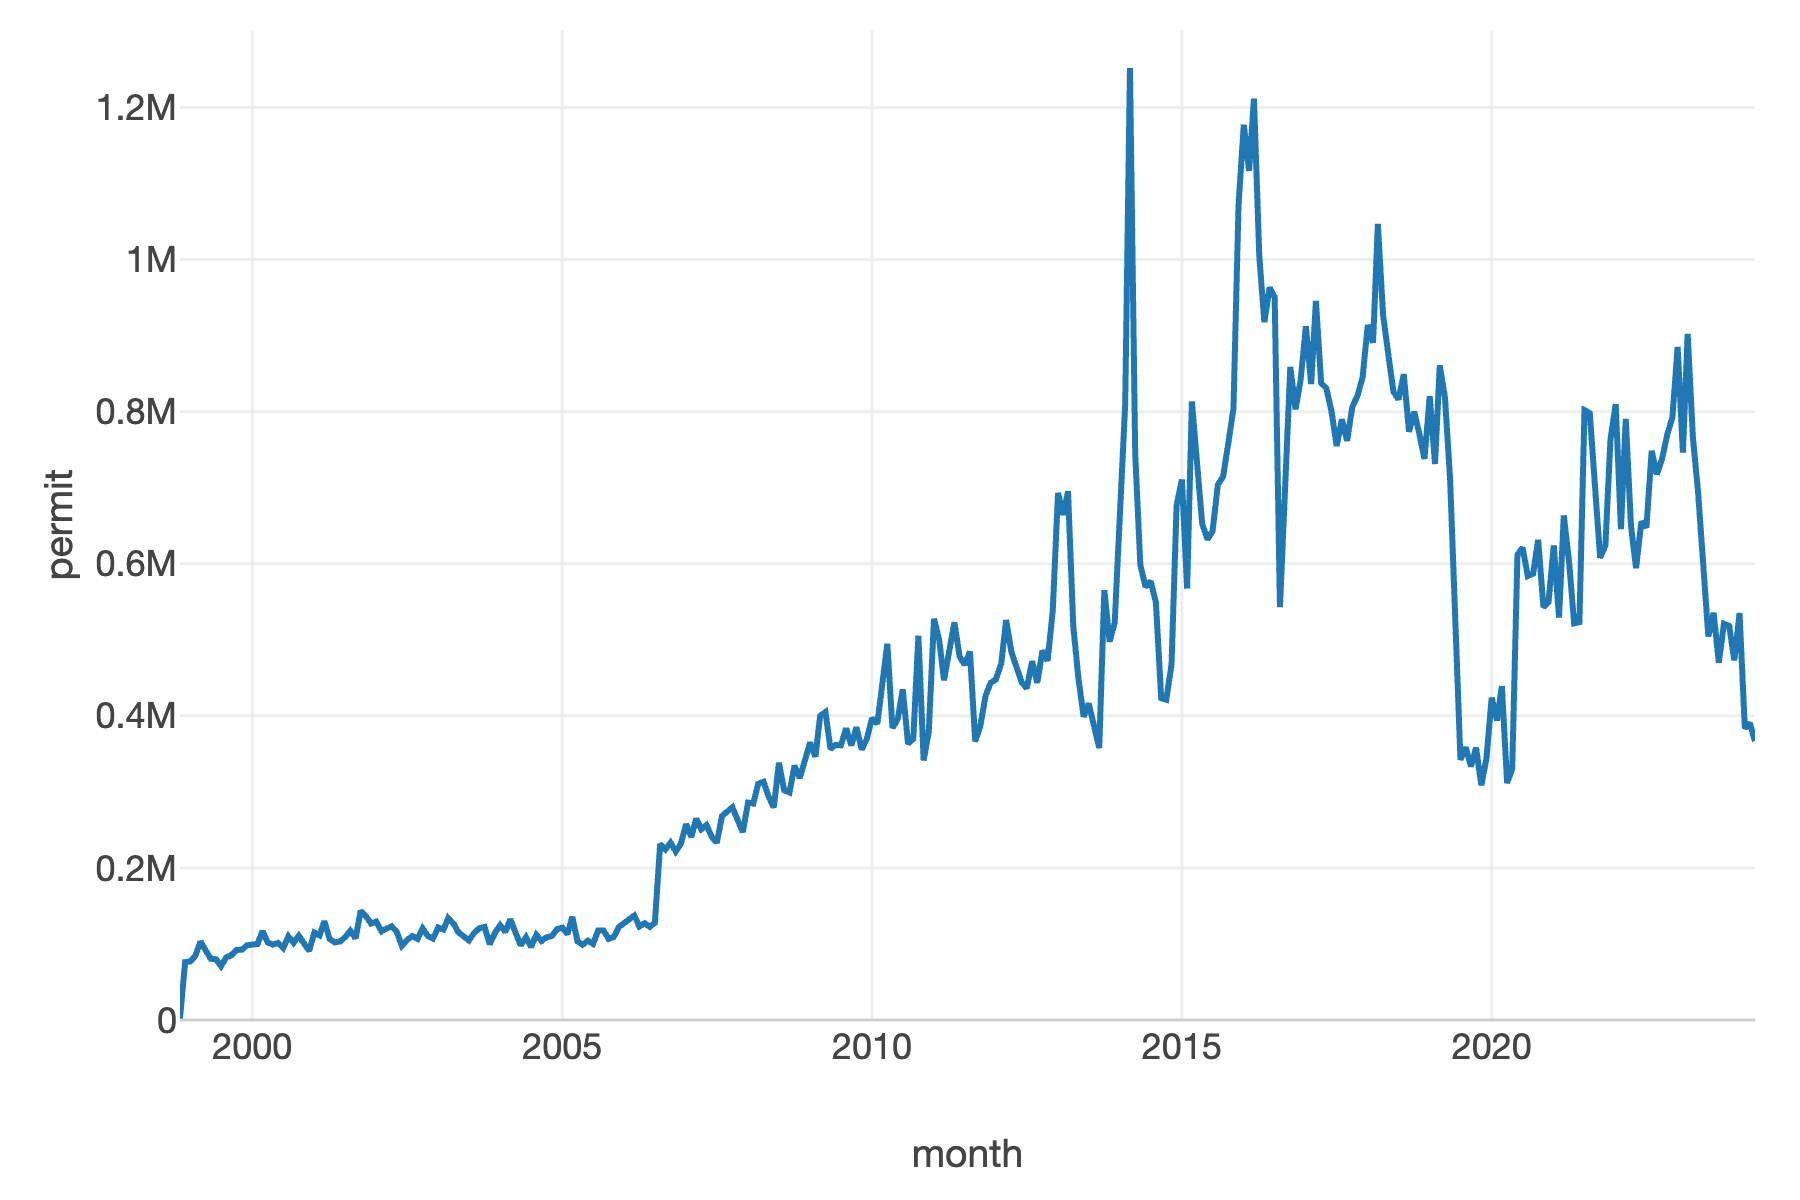
In the line chart below, we see an increase in 2006 and a large spike around 2015. I have not been able to pinpoint the exact reason for this, as much of this is outside my specialty, but I’m sure others can provide better insights.
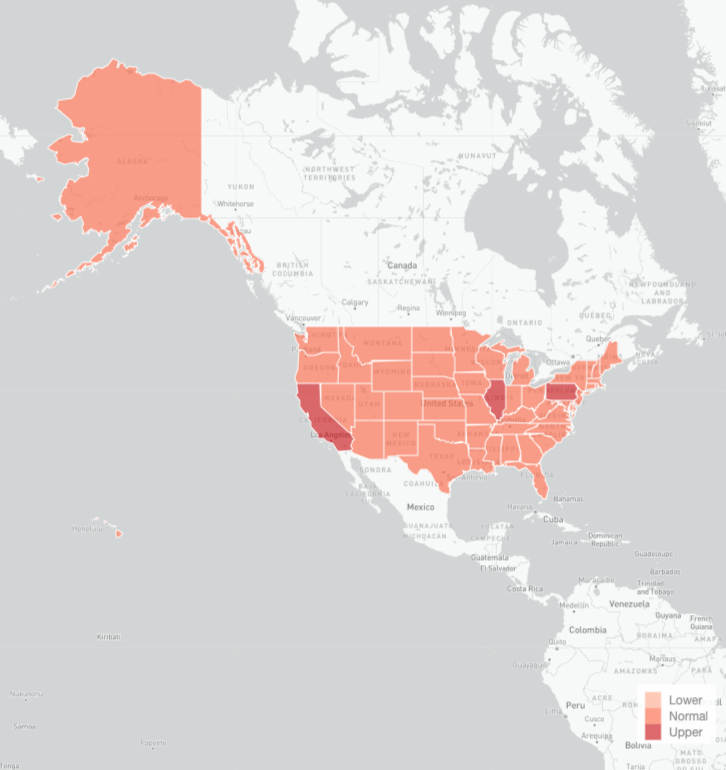
By dividing the permits by interquartile range, we can identify outliers and better understand the distribution of permit checks across states. The map below shows the relative intensity of permit checks, with darker shades indicating higher volumes. We can see that Illinois, California, and Pennsylvania stand out.
Permit Rechecks
Some states conduct periodic rechecks in addition to initial permit checks to ensure permit holders remain eligible. Kentucky dominates this list. Most likely, this is due to Kentucky’s concealed carry permit system, which requires permit holders to renew their permits every five years.