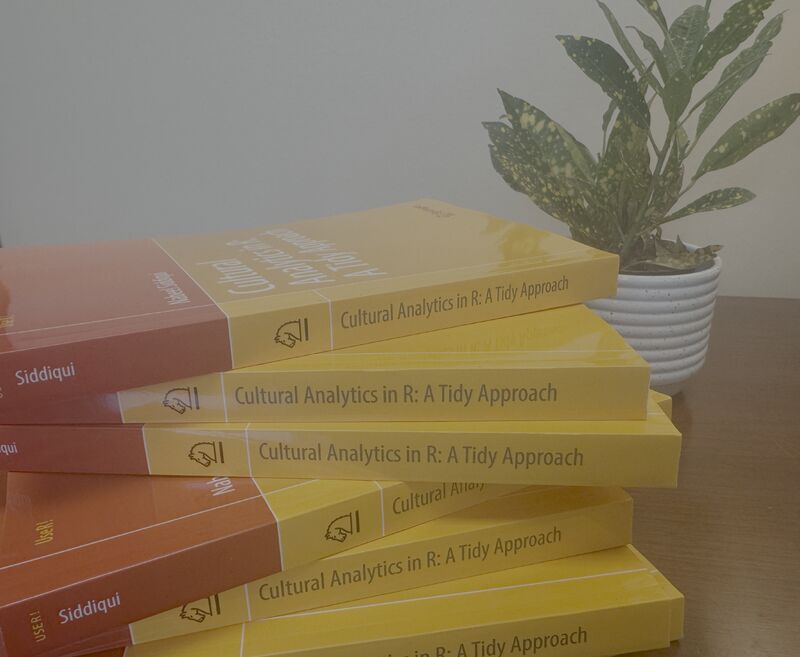
Announcing My New Book: Cultural Analytics in R - A Tidy Approach
Exciting news: my book Cultural Analytics in R: A Tidy Approach has just been published by SpringerLink! This is the first book that brings together the many ways tidy data principles can be used across cultural analytics workflows. I’m grateful to everyone who has expressed interest in this project and supported its development.
So what exactly is Cultural Analytics in R? Well, it’s my attempt to fill a gap I’ve been thinking about for years—how do we get humanities folks comfortable with computational methods without scaring them away with too much technical jargon? As historian Roy Rosenzweig pointed out way back in 2003, we’ve moved from “a culture of scarcity to a culture of abundance” in our digital world. Suddenly, we have access to massive archives of cultural data, but most humanities scholars weren’t really trained to handle that scale of information.
This book is designed to bridge that gap between traditional humanities research and what Lev Manovich calls cultural analytics—“the analysis of massive cultural data sets and flows using computational and visualization techniques.” But here’s the thing: this isn’t about replacing close reading or interpretive analysis. It’s about giving scholars new tools that can reveal patterns they might not see otherwise.
Why R? (And Why Not Python or Something Else?)
I get this question a lot! R might seem like an odd choice since it’s mainly known for statistics R has an amazing ecosystem of packages that all work together really well, especially when you’re dealing with different types of cultural data—text, images, numbers, geographic information—sometimes all in the same project. These packages work with “tidy data” (thanks, Hadley Wickham!). It’s basically a way of organizing your data that makes everything else easier. Once you get the hang of it, you can move seamlessly between different data types.

What’s Actually In The Book
I tried to make this as hands-on as possible, using datasets that are actually interesting (no boring spreadsheets of random numbers!). Here’s what we cover:
- Getting Started: We dive right in with Olympic athlete data—120 years worth—to learn the basics without getting overwhelmed
- Data Wrangling: Using American film data from the 1960s to today to master the “tidyverse” (trust me, it’s less intimidating than it sounds)
- Making Pretty Graphs: Learning ggplot2 with a dataset of 90,000 songs and their emotional tags
- Text Analysis: Diving into works by F. Scott Fitzgerald, Charlotte Perkins Gilman, and Mary Shelley
- Statistics That Actually Make Sense: Using Pokémon battle data to understand regression (because who doesn’t want to predict which Pokémon will win?)